A well-adapted UK
Animation / Campaign
Interactive data visualisation
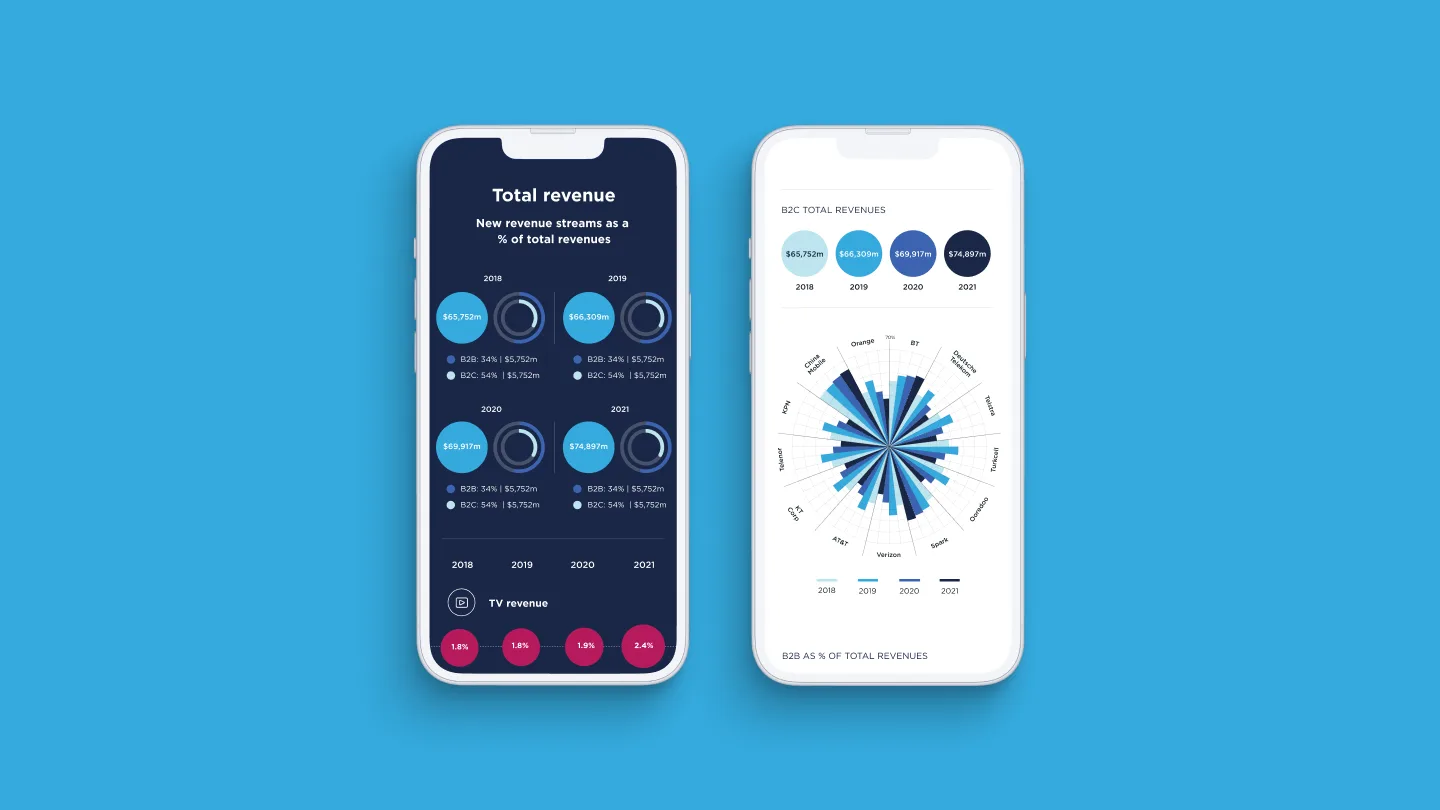
The telecom sector moves fast, and the data behind it rarely keeps pace. TMForum's research team needed a way to make revenue growth data from 33 global operators genuinely useful and accessible.
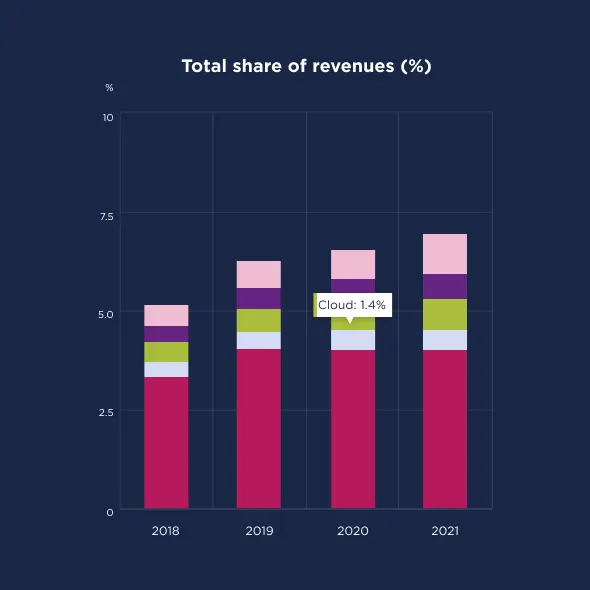
Executives and analysts working across the industry needed to interrogate complex, multi-variable data without requiring a high level of technical expertise. Deep dives and customised views of the raw figures weren't enough. It was important that the new data tool could tell a story.
Data analysis & narrative
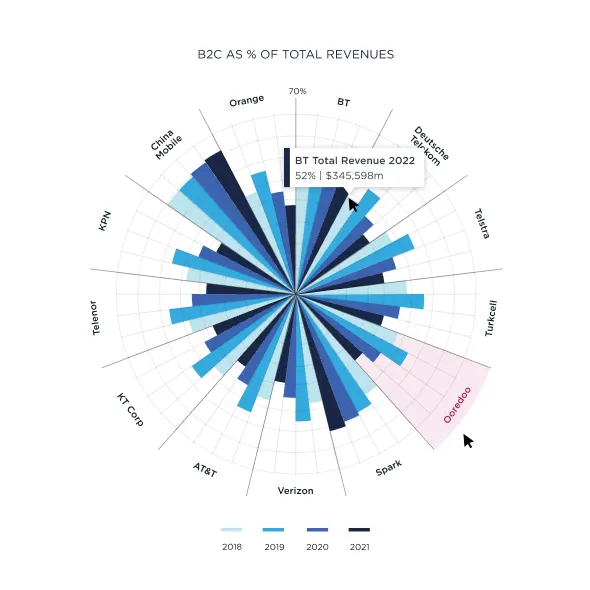
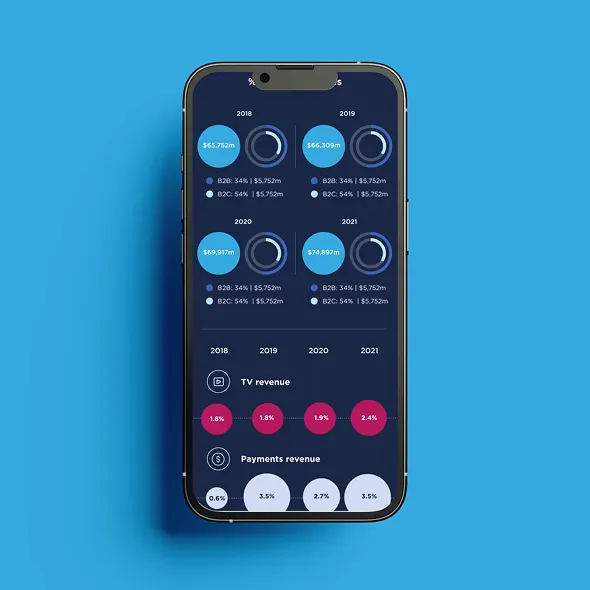
Soak designed and developed a fully integrated interactive data tool, deployed directly on the TMForum website.
Users move through a structured journey, from a high-level view of historical industry performance, through to granular filtering and comparison across revenue streams, service lines, and individual operators. Every design decision was made in service of clarity: intuitive navigation, dynamic visualisations, and a fluid interface that reduces friction at every step of the journey.
A successful result
A fully integrated tool that makes complex data immediately accessible, and one built with adaptability in mind.
The success of the first iteration is already being expanded for the Asia Pacific region, with further markets to follow.