The Trade
Animation / Data vis
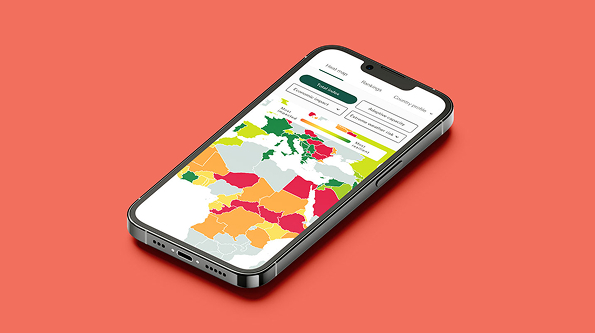
Infographics | Interactive reports | Dashboards | Benchmarking tools | Annual reports | Data tools | Data-driven animation
Data is only as valuable as the transparency with which it's communicated. We help organisations turn complicated information and data into accessible narratives that are easy to understand and impossible to ignore.
From bespoke infographics and interactive reports to fully integrated dashboards and data exploration tools, our work makes the invisible visible. We've delivered across sectors at scale for global businesses and organisations to make their data deliver.
Yes, and it's more common than you might think. Data preparation is often the most important part of the process. We interrogate, clean and structure data before a single visualisation is designed, to ensure our solutions are accurate and accessible.
A static infographic clearly and efficiently tells a fixed story, rendering it ideal for reports, presentations, and social content. An interactive visualisation lets users explore the data themselves and uncover their own insights.
Yes. We build fully integrated dashboards that connect to live data sources and refresh automatically. We'll work with your existing data infrastructure to ensure the connection is reliable, secure and built to scale.
We operate across a number of sectors, including financial services, healthcare, and government. We take data security seriously and work within agreed protocols to ensure confidential information is processed appropriately at every stage.
Yes. We build with integration in mind. Whether it's integrated into a website, a digital report, or a third-party platform, we ensure the output works seamlessly within your existing environment.
By keeping the audience front of mind throughout the entire process. We test comprehension, simplify where necessary, and never let visual complexity compromise clarity of information.