A well-adapted UK
Animation / Campaign
The economics of climate change
As Swiss Re’s global design partner, we help them bring their data to life.
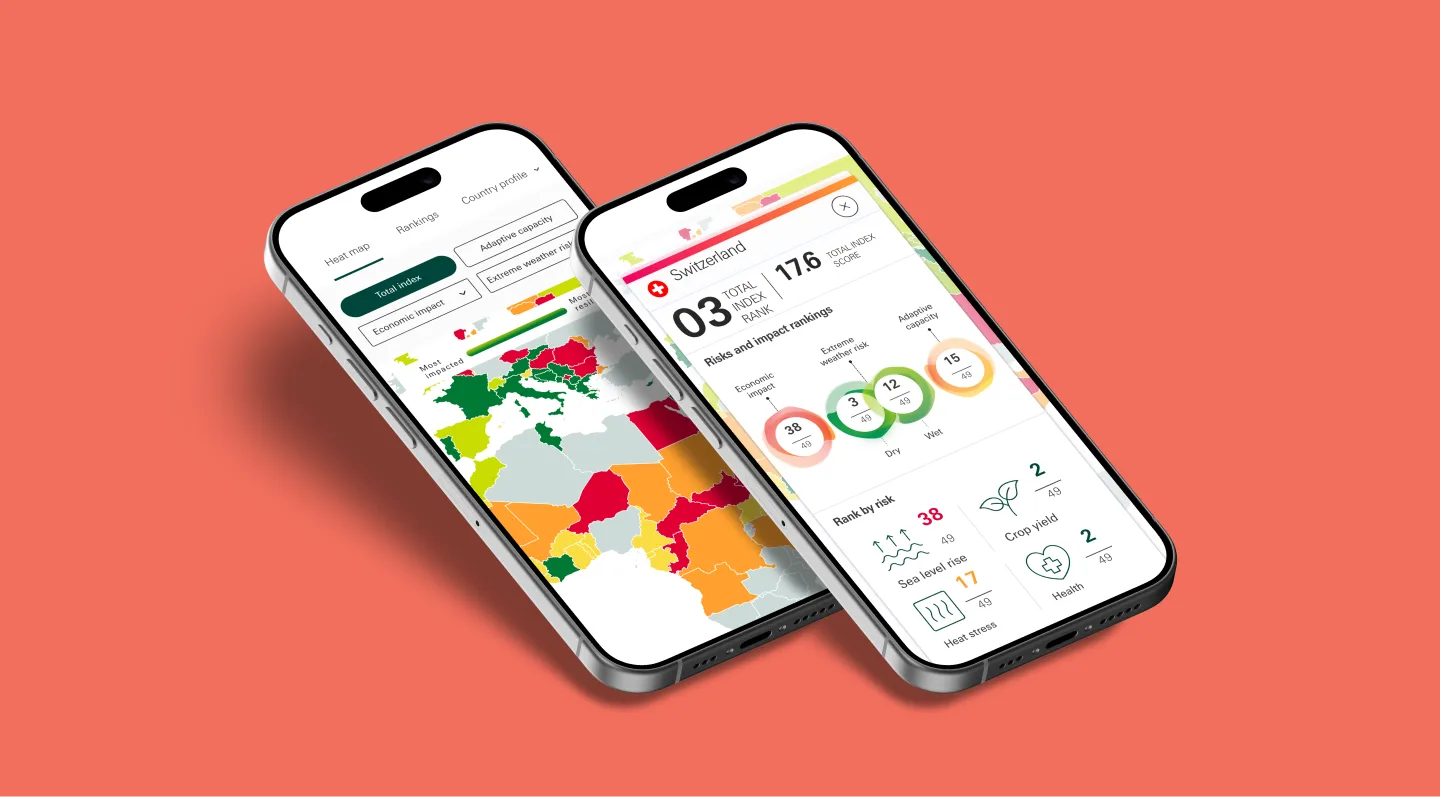
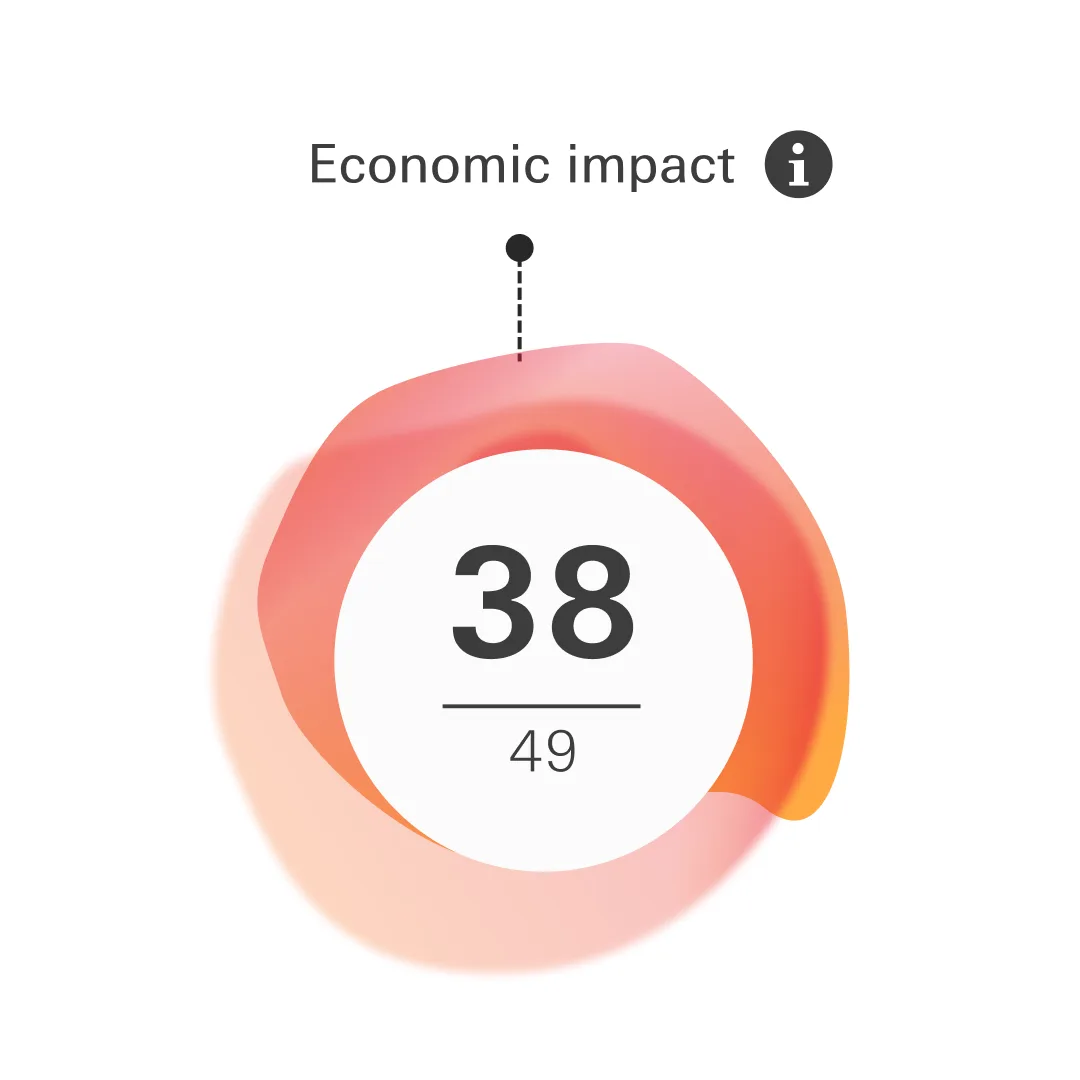
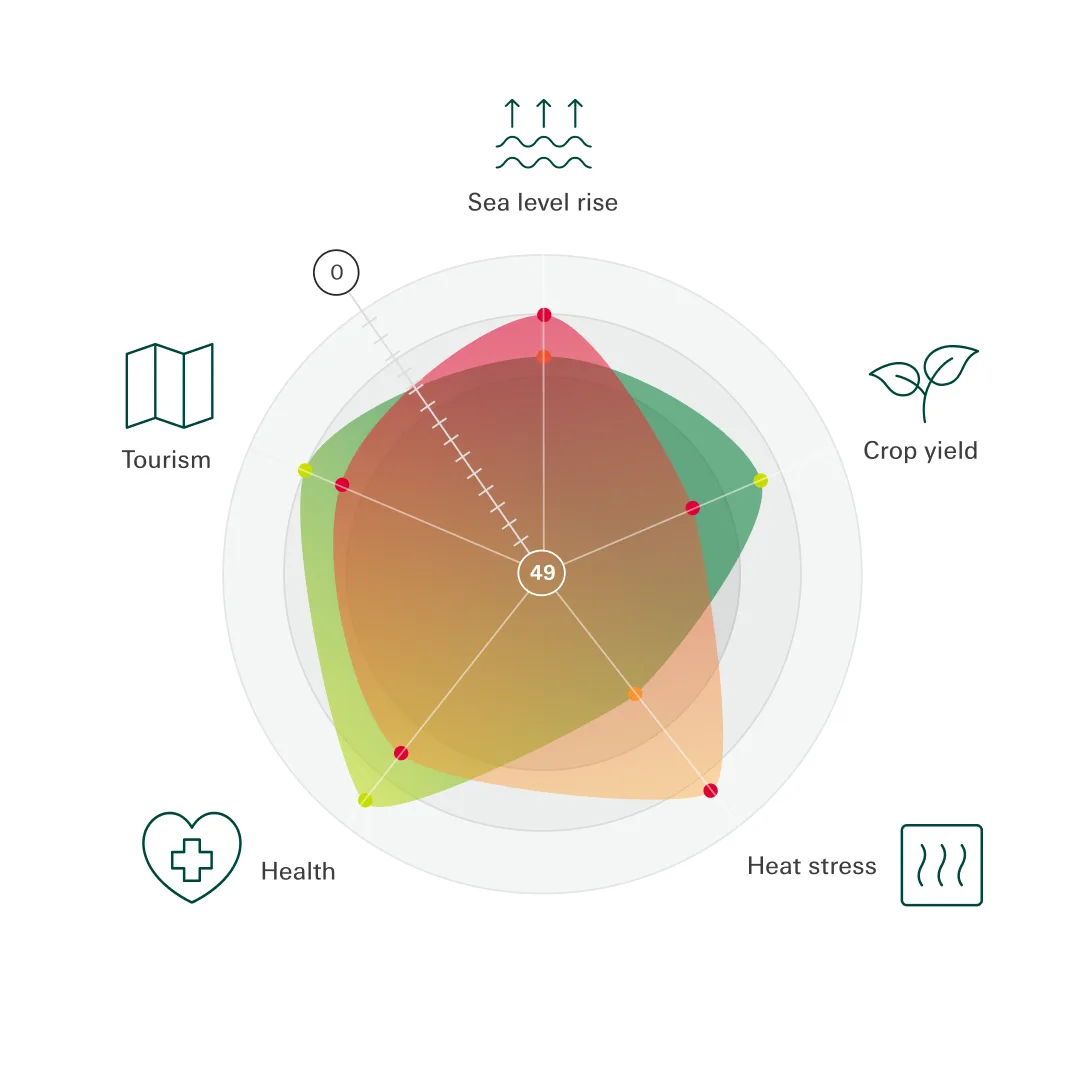
Swiss RE's researchers had built something significant: the Climate Economics Index, a model that measures how climate change will affect 48 countries representing 90% of the world's economy. The vast array of raw data needed a form that made it explorable, comparable, and compelling to a global audience.

data visualisation for global good
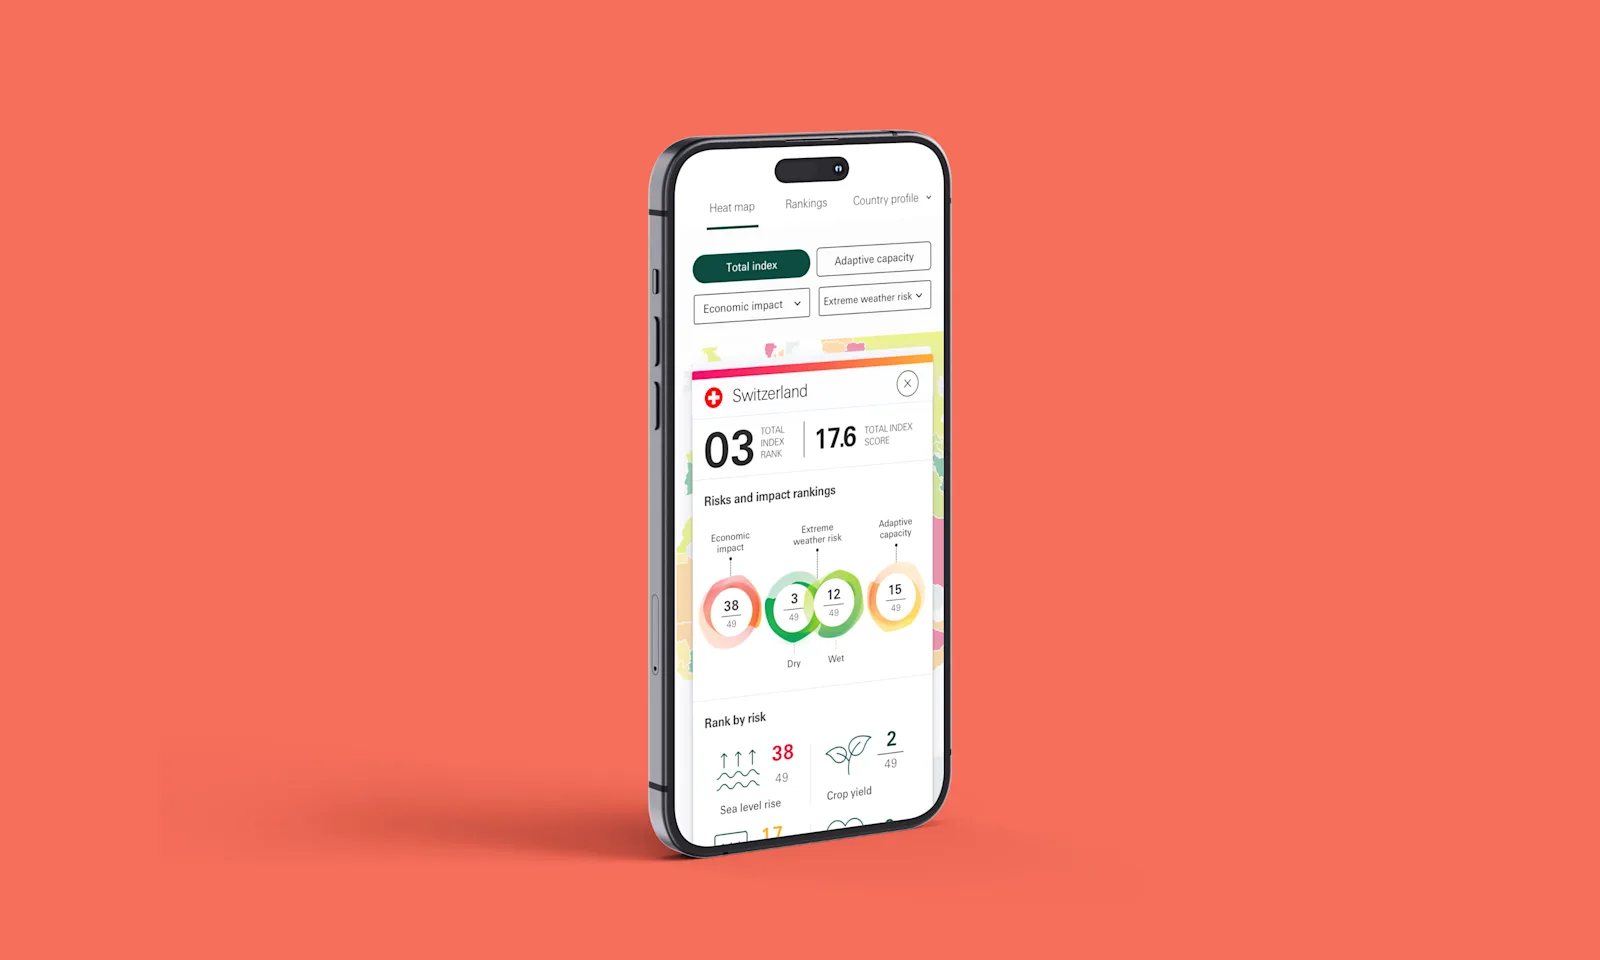
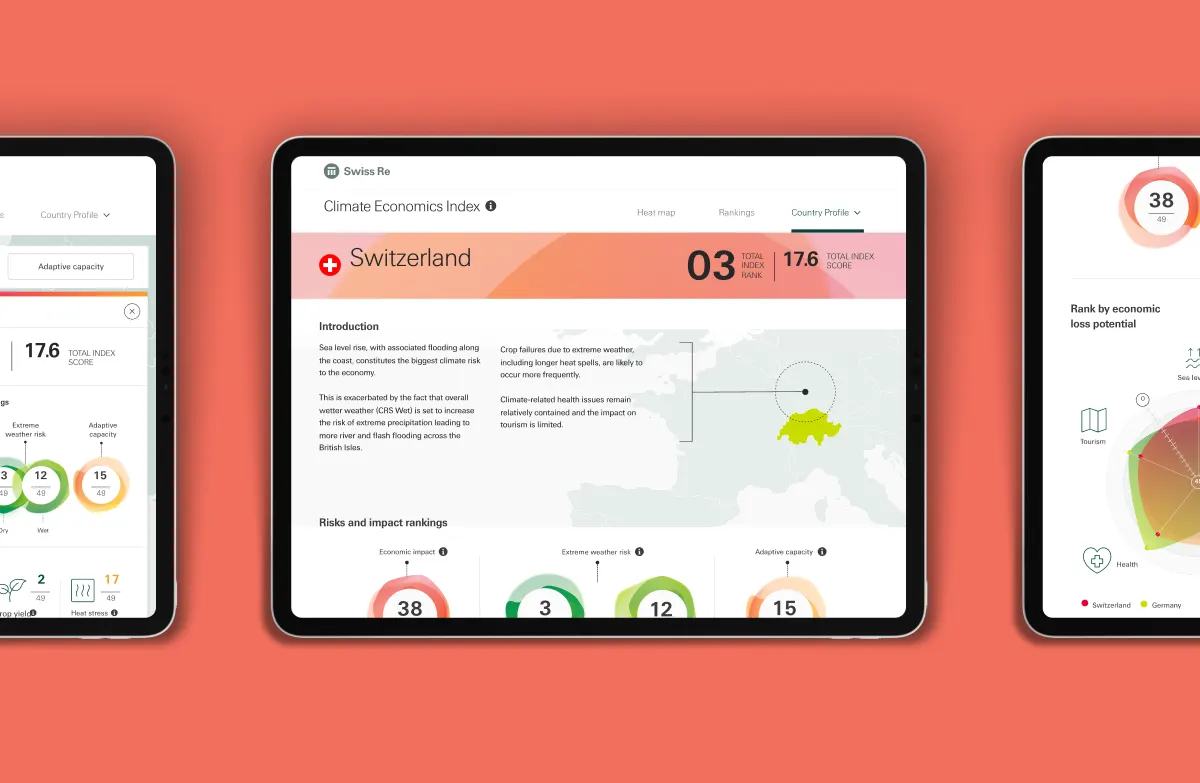
Soak designed and developed an immersive data index using a map-based interface that seamlessly integrates with Swiss RE's existing web framework.
Users can move fluidly between countries and variables, drawing their own comparisons across a wide range of climate resilience metrics without the experience ever feeling like a data extraction exercise. To raise awareness of the data tool, we also produced a suite of campaign assets designed to carry the work beyond the platform and into broader public conversation.

A successful result
The index became the centrepiece of Swiss RE's Climate Resilience Campaign, with coverage in the New York Times and several other global publications.
The platform also underpinned the key report that launched Swiss RE's presence at COP22, and continues to be updated with new data.