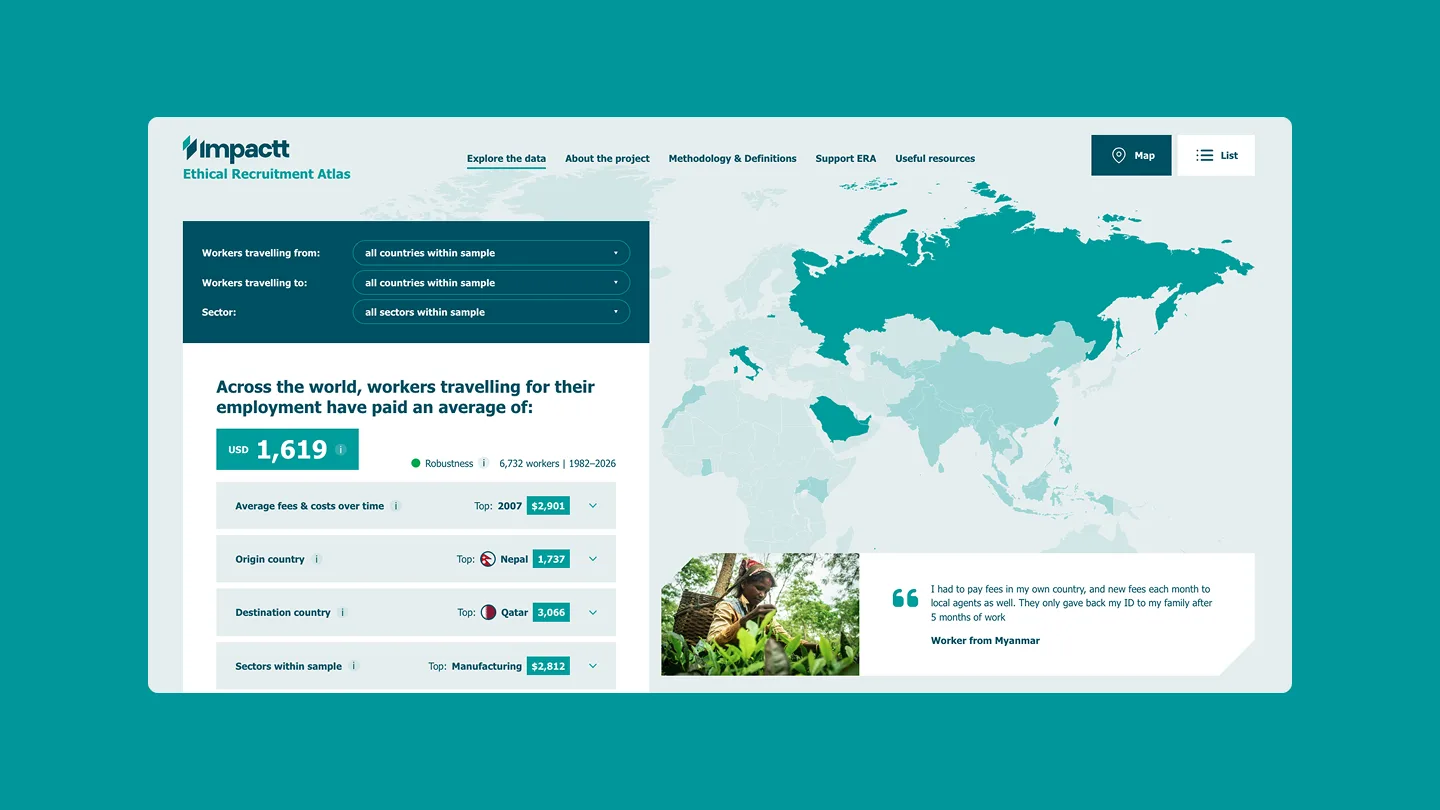
Data visualisation  /  Development

Global Health 50/50

Gendered health pathways

Sharing global time series research data on gender differences in the clinical pathways for Hypertension, Diabetes, and HIV/TB.

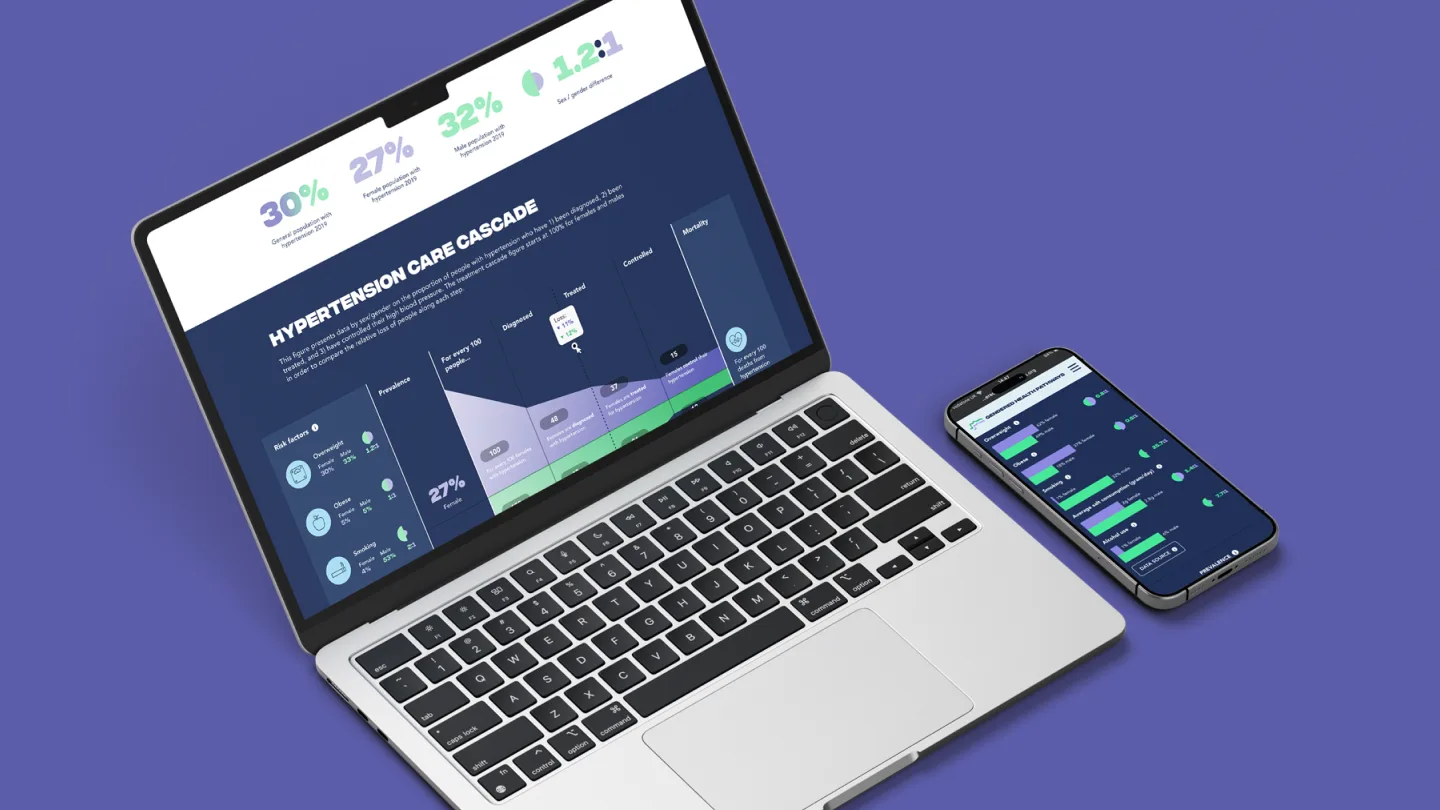
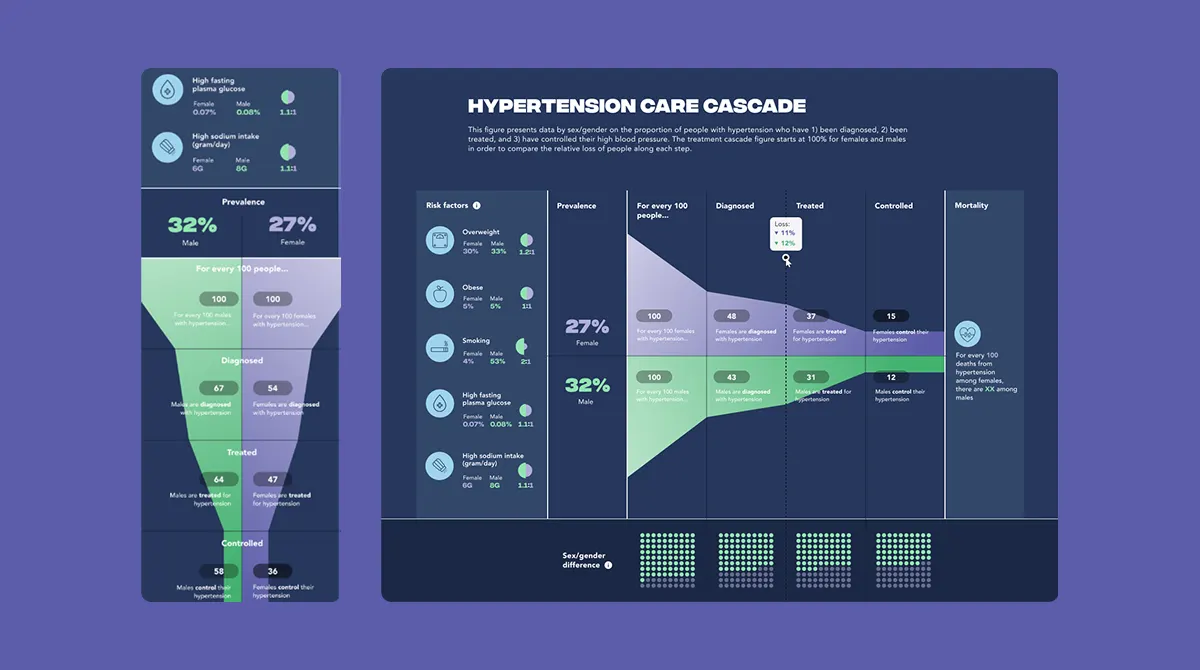
We supported Global Health 50/50 to visualise a wealth of information about health conditions and access barriers, across countries and genders. The map-based interface allows users to easily browse and see the spread of conditions the world over, with fully-responsive data visualisations.
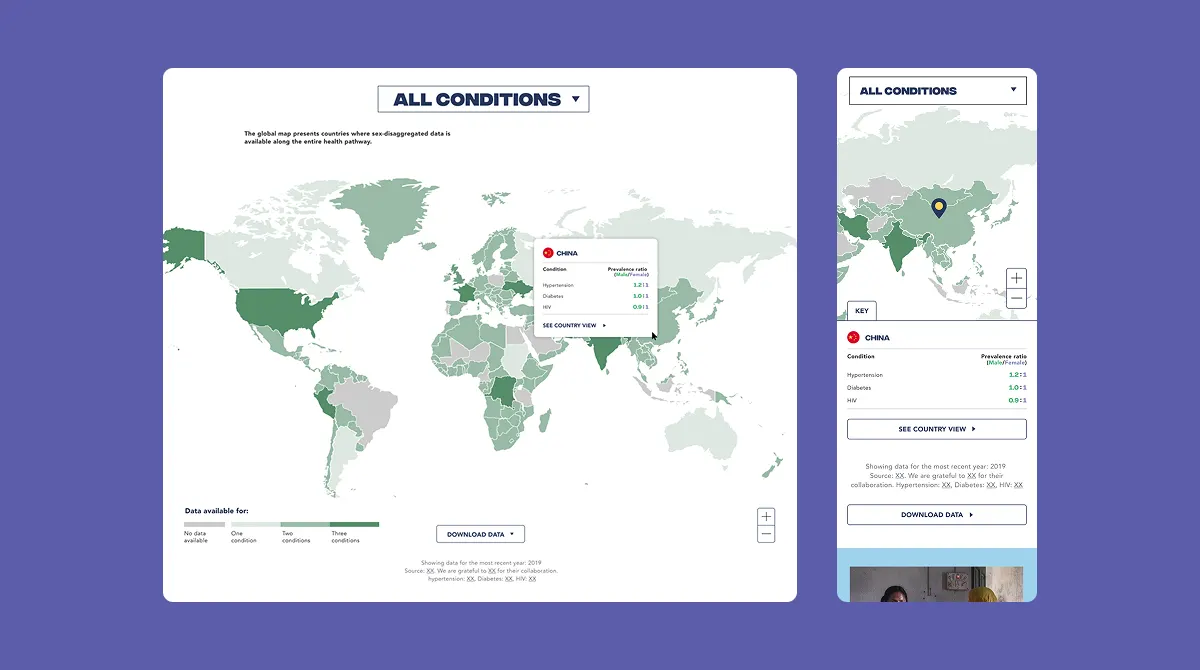
  • A map based data visualisation interface showing health conditions across the world.
  • Data visualisation of hypertension care cascade

A really beautiful, valuable tool.

You've helped transform a seed of an idea and a hundred spreadsheets and data points into a really beautiful, valuable tool.”

Sonya Tanaka, Deputy Director/ Global Health 50/50

Let’s talk about your next project.

No pressure, no obligation, just a useful conversation. Tell us about your brief or project, and we'll come back to you with a clear sense of how we'd approach things.

Related work