A well-adapted UK
Animation / Campaign

A reporting system reimagined
Client reporting is often where brand quality can subtly decline. EZRA aimed to ensure theirs remained pristine for a global audience of C-suite executives.
EZRA's Discover product needed a client reporting solution that felt genuinely premium, visually consistent, on-brand, and could be produced by team members without advanced design skills. PowerPoint wasn't cutting it. The reports needed to work harder, look sharper, and be sustainable to produce at scale.
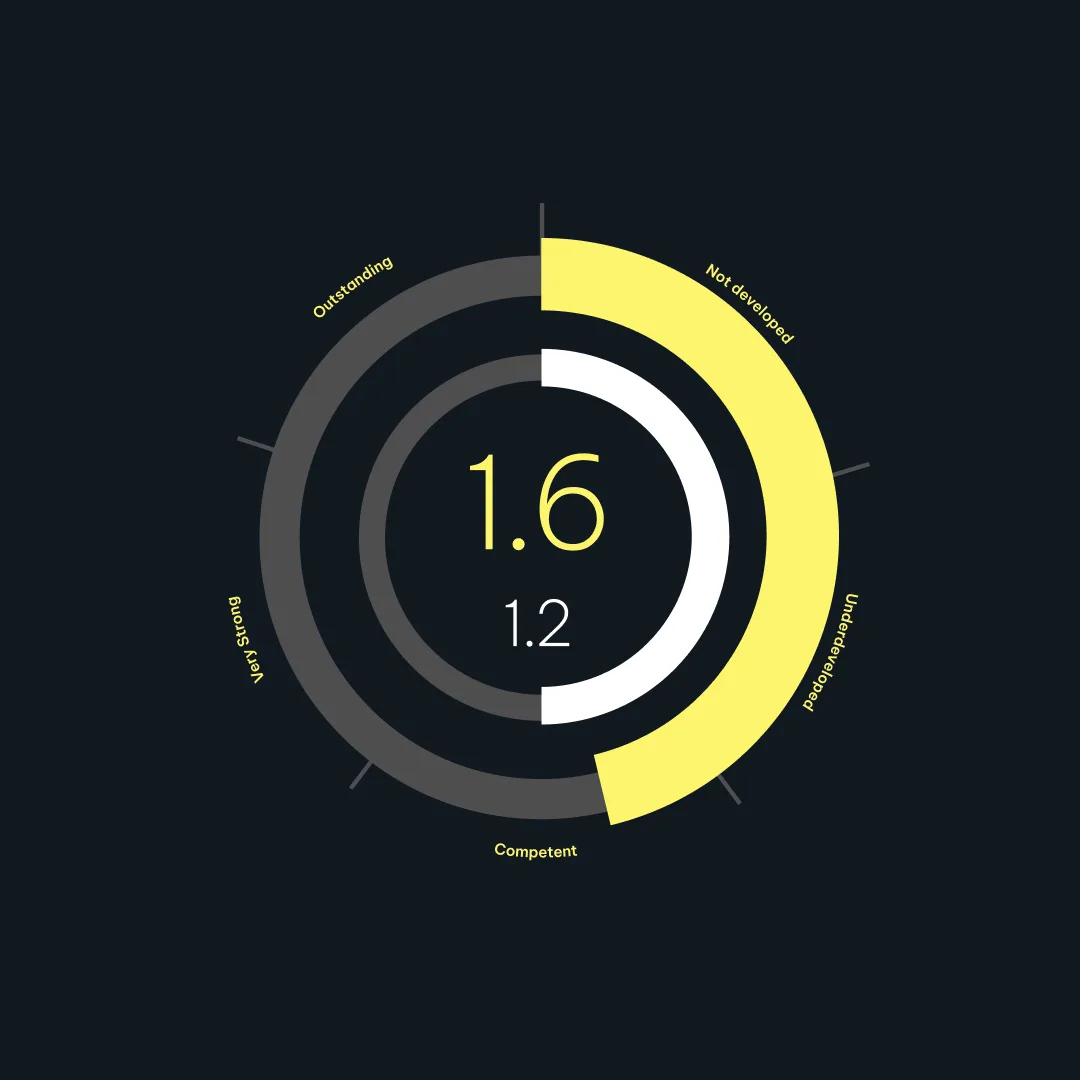

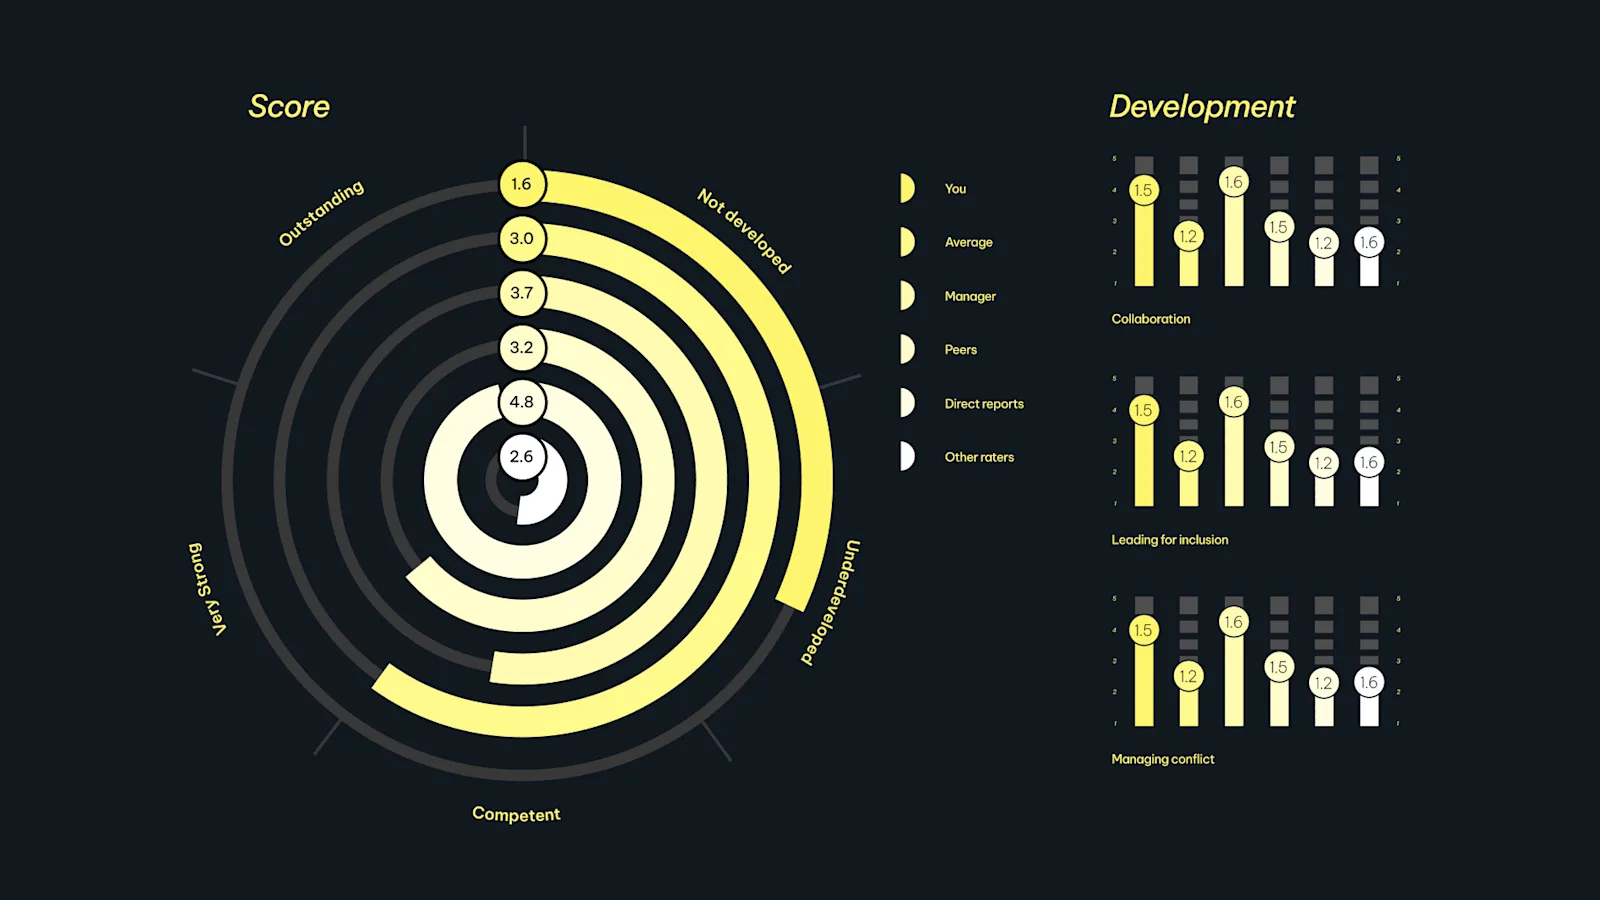
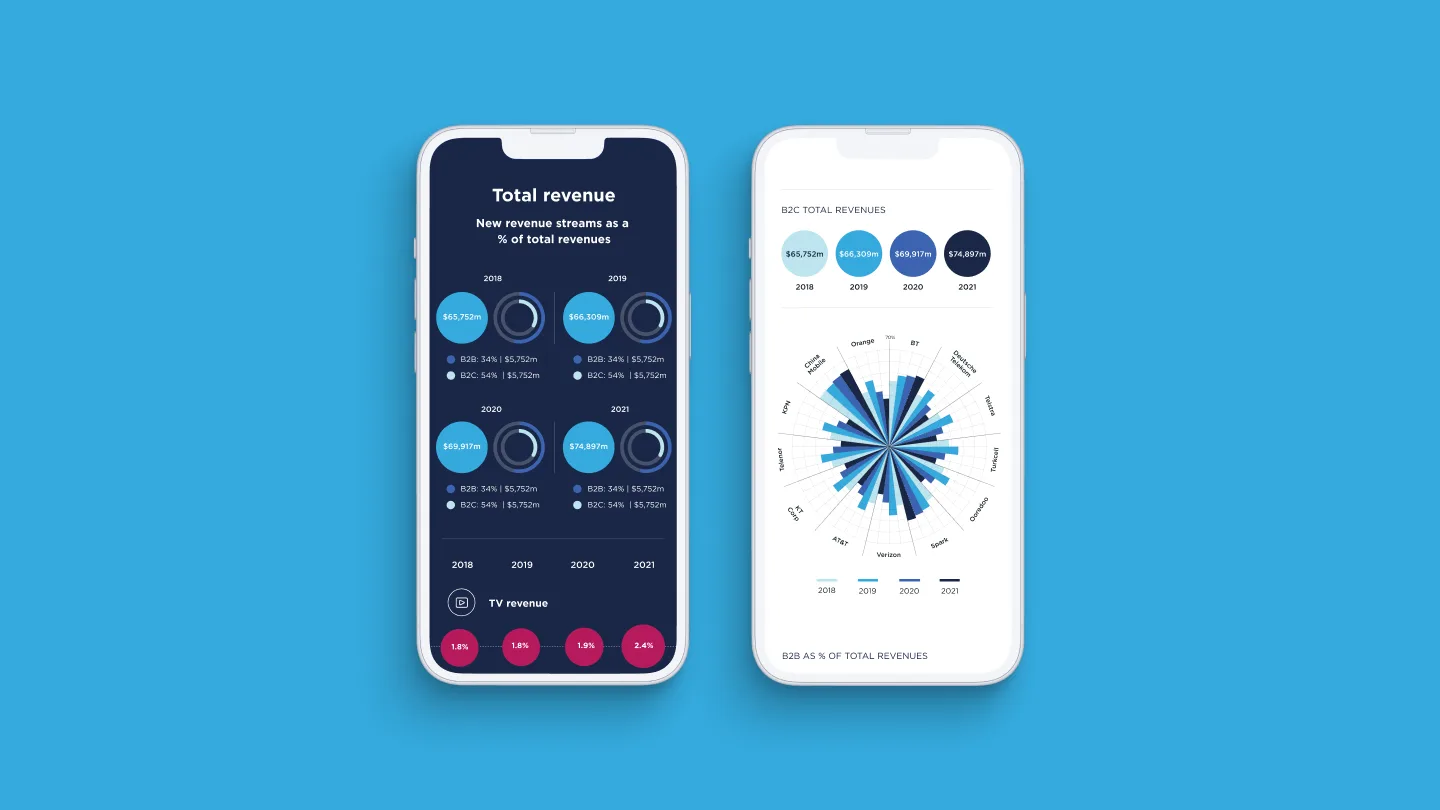
Data-responsive visualisation
Soak designed a comprehensive reporting template system in Figma, built around the Discover brand and engineered for flexibility.
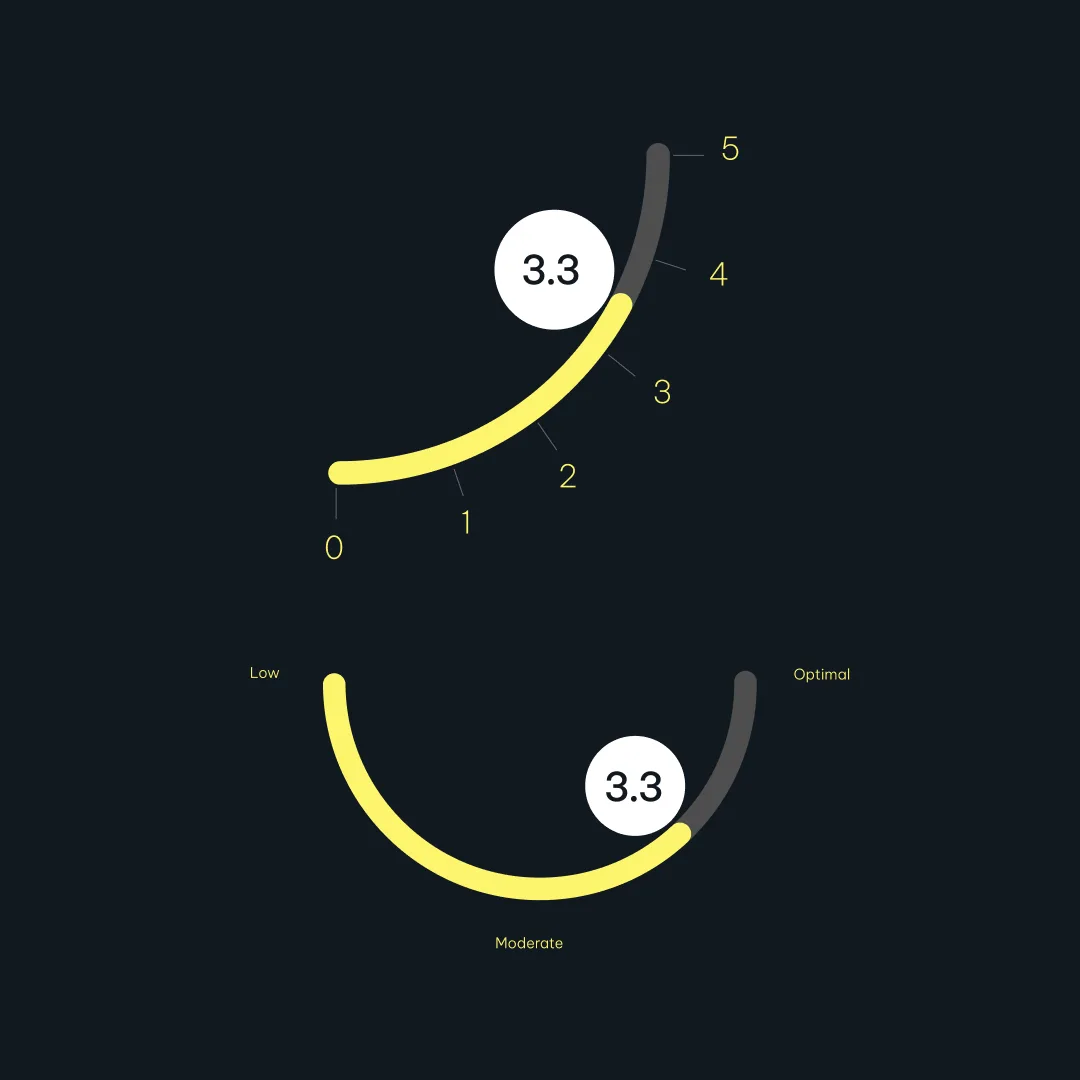
A modular layout framework (grids, reusable sections, charts, and visualisations) enables reports to be assembled and adapted without compromising consistency. Data visualisations were developed as standalone editable components, with clear annotations guiding users through updates. Figma plugin integration refreshes chart values from CSV or direct input, eliminating the need for design intervention whenever the numbers change.
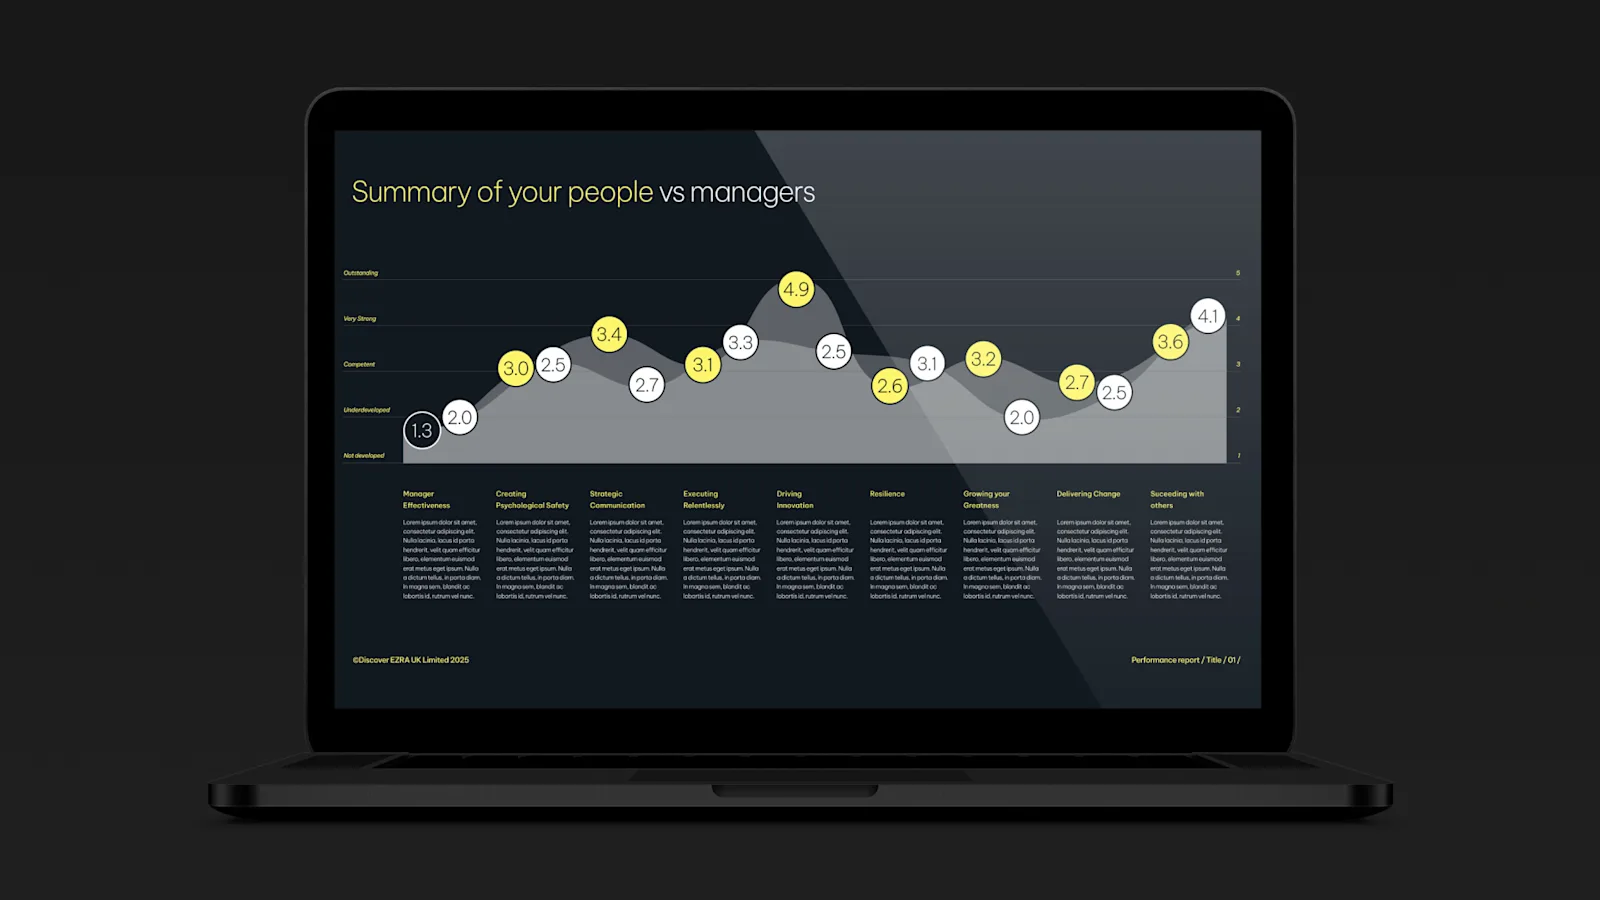

A successful result
The final design system sits in a shared Figma library, complete with a style guide, usage instructions, and a finished example report, giving EZRA's team everything needed to produce polished, consistent reports without compromise.
The solution elevates EZRA's client-facing output, reduces dependency on design resources, and scales efficiently as reporting requirements evolve.