A well-adapted UK
Animation / Campaign
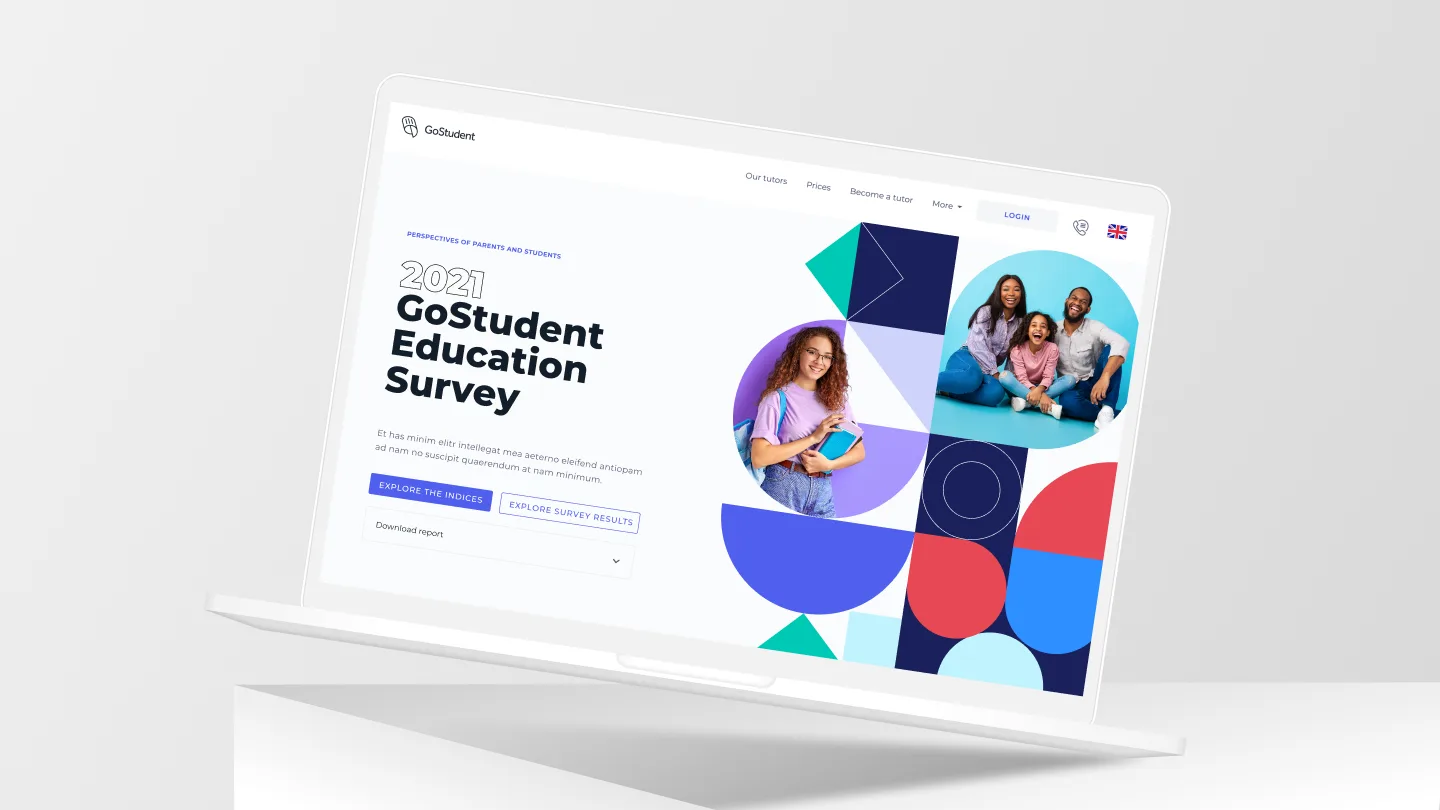
The European Education Survey
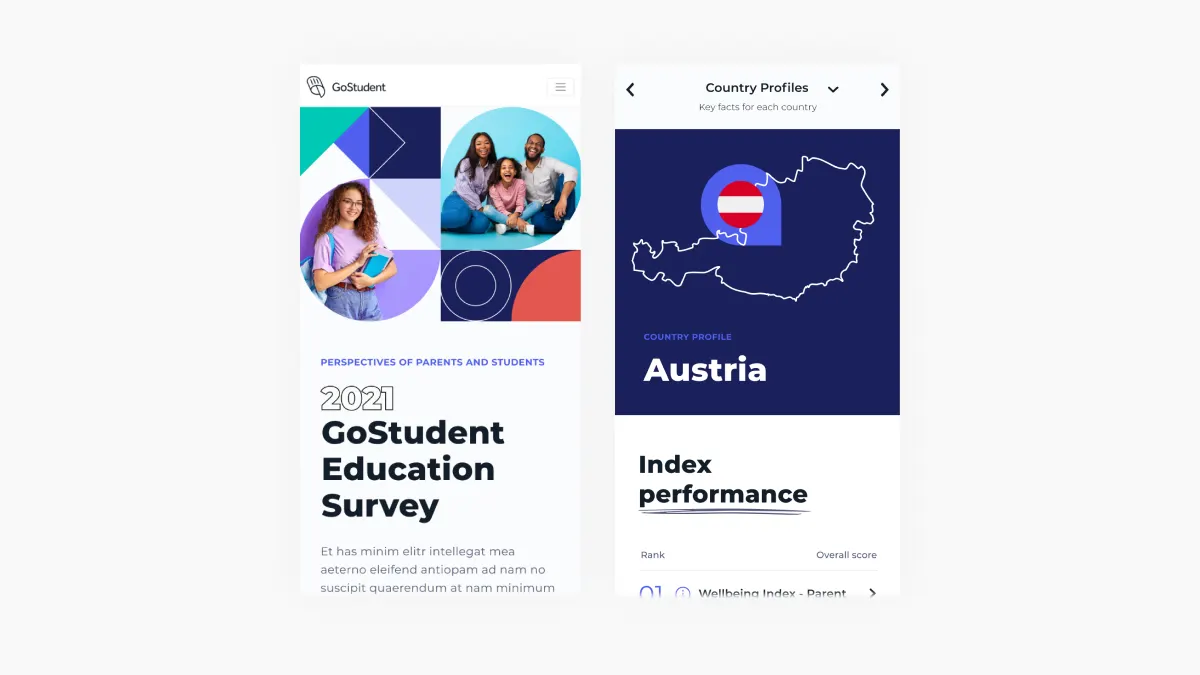
GoStudent conducted an in-depth seven-country survey that drew on the perspectives of both parents and students, yielding a substantial body of research on education trends across Europe. The brief was to bring the data to life in an explorable online interface.
Static data and a written report weren't going to reflect the scale of the undertaking or reach the audience the research deserved. GoStudent needed an interactive experience that matched the ambition of the survey itself, delivered at pace, and seamlessly integrated with their existing website infrastructure.
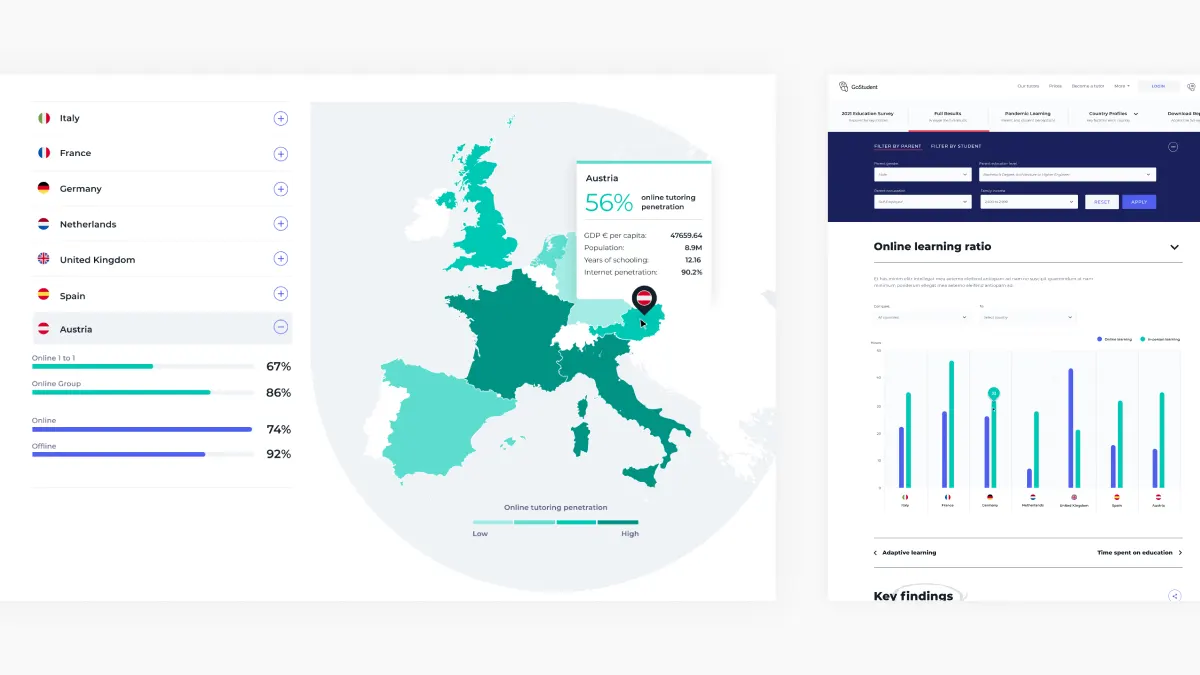
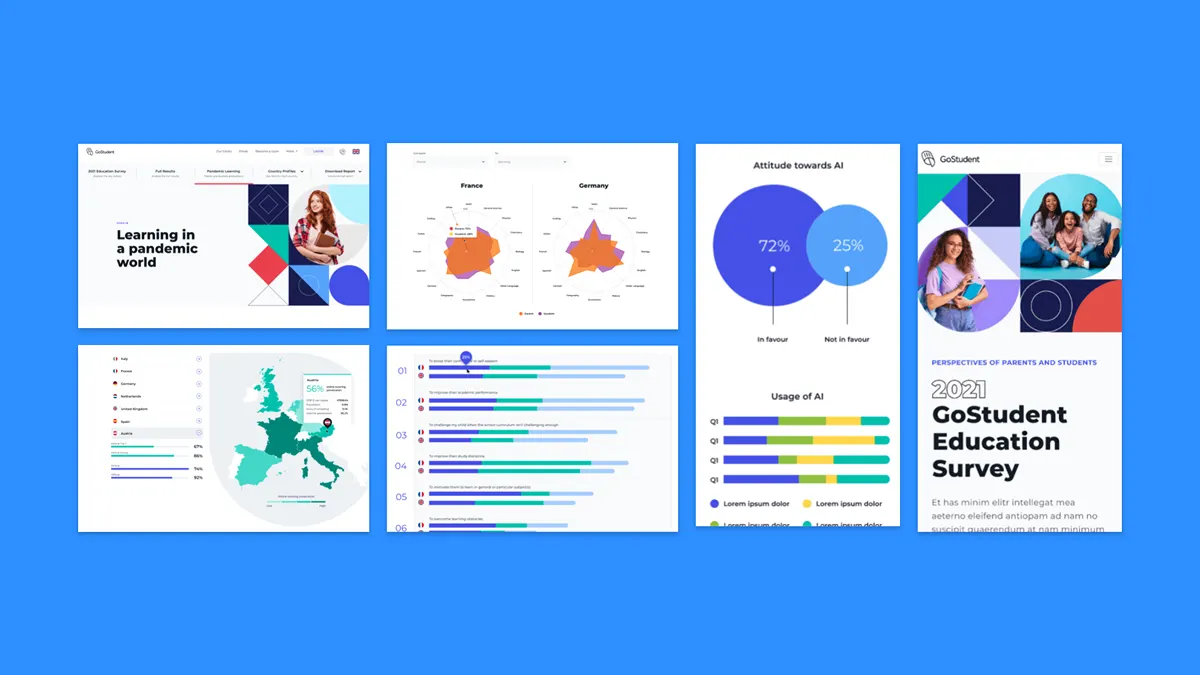
Interactive data visualisation
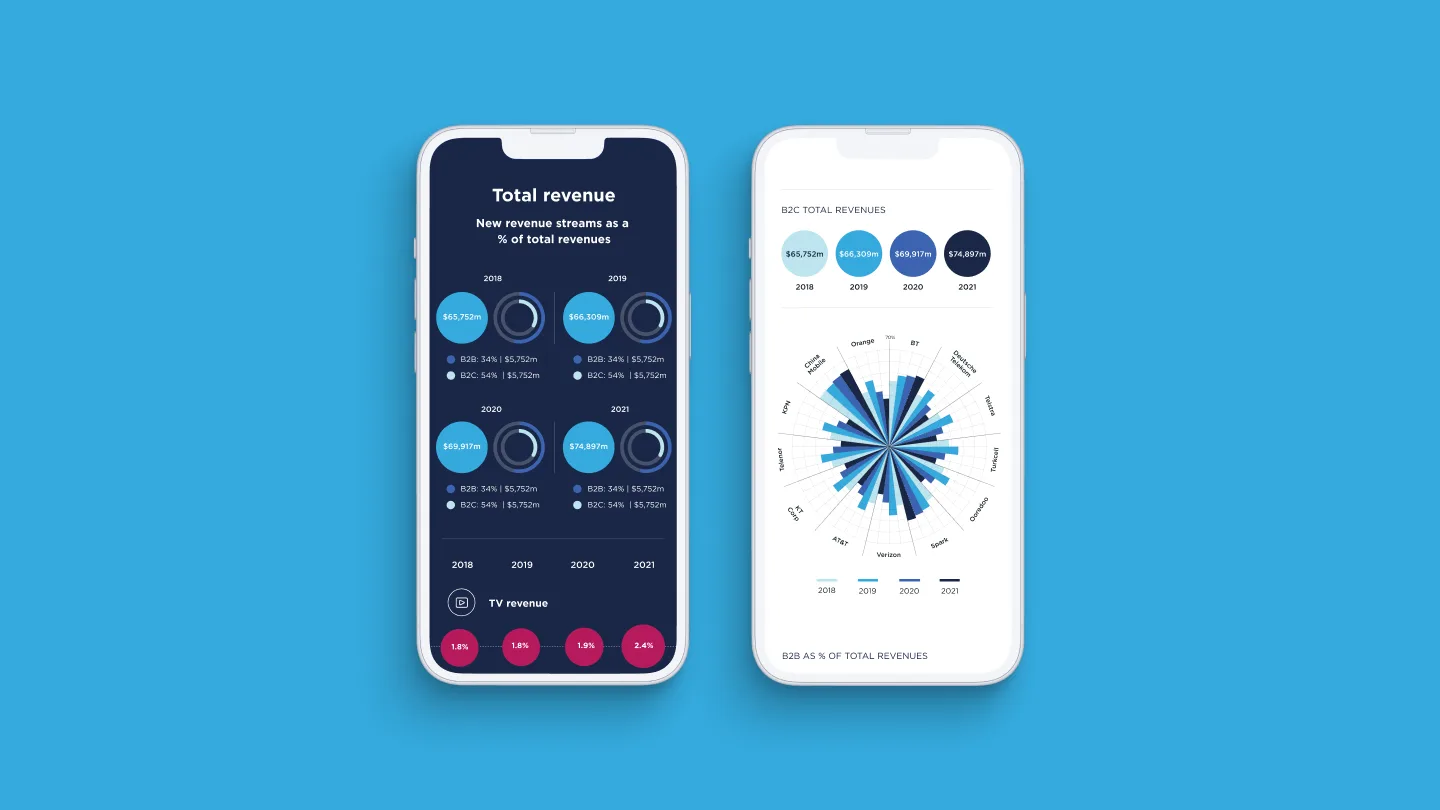
We developed a premium interactive data tool that encompasses country profiles, indices, survey results, and comparative analyses, all powered by a data architecture engineered for speed.
An innovative client-side rendering approach ensured the experience remained fast and fluid despite the considerable volume of data underpinning it. Multilingual delivery was built in from the outset, ensuring the tool performed consistently across all seven markets. Every design decision was made in service of clarity, delivering a wide variety of unique, accessible data views and visualisations.
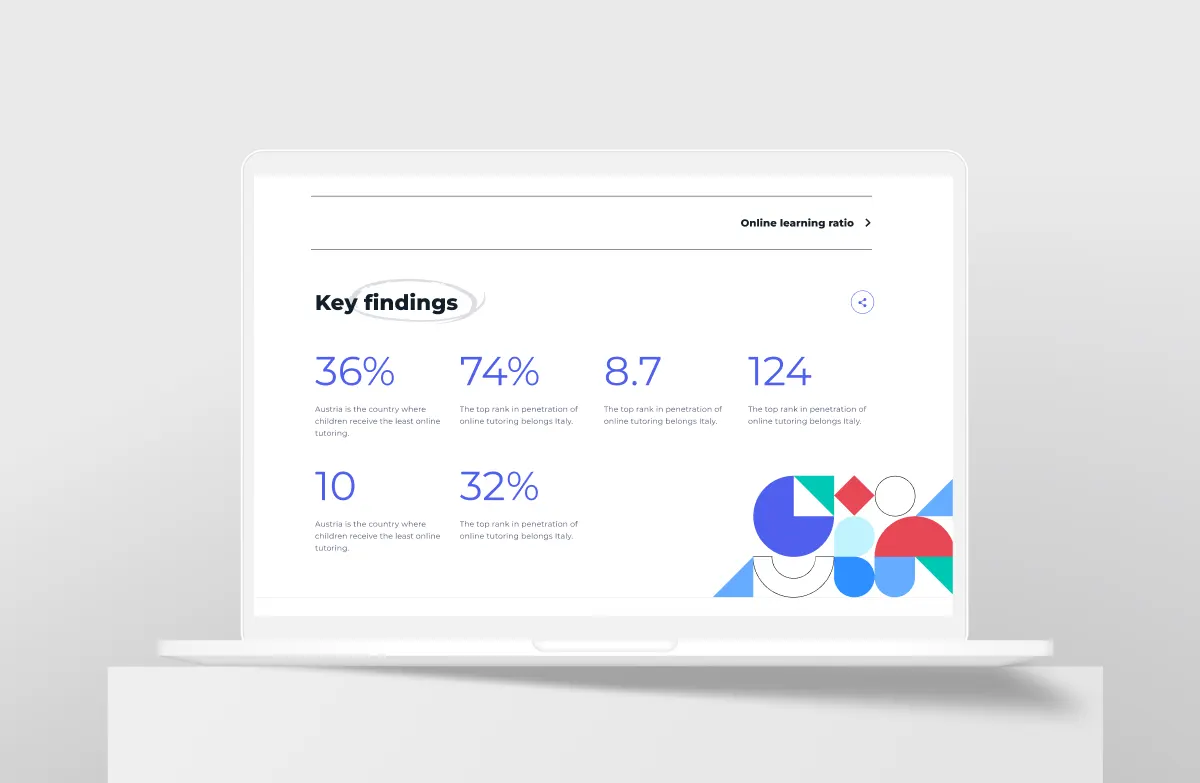
A successful result
The tool generated significant media coverage across Europe, with features in AD, El Economista, Die Welt, Krone, and Il Sole 24 Ore.
The initiative was picked up by news agencies across the continent, earned radio coverage in Germany, and reached television in Austria.