Open Menu
Home
work
work
All
Animation
Campaign
Data Vis
Development
Digital Design
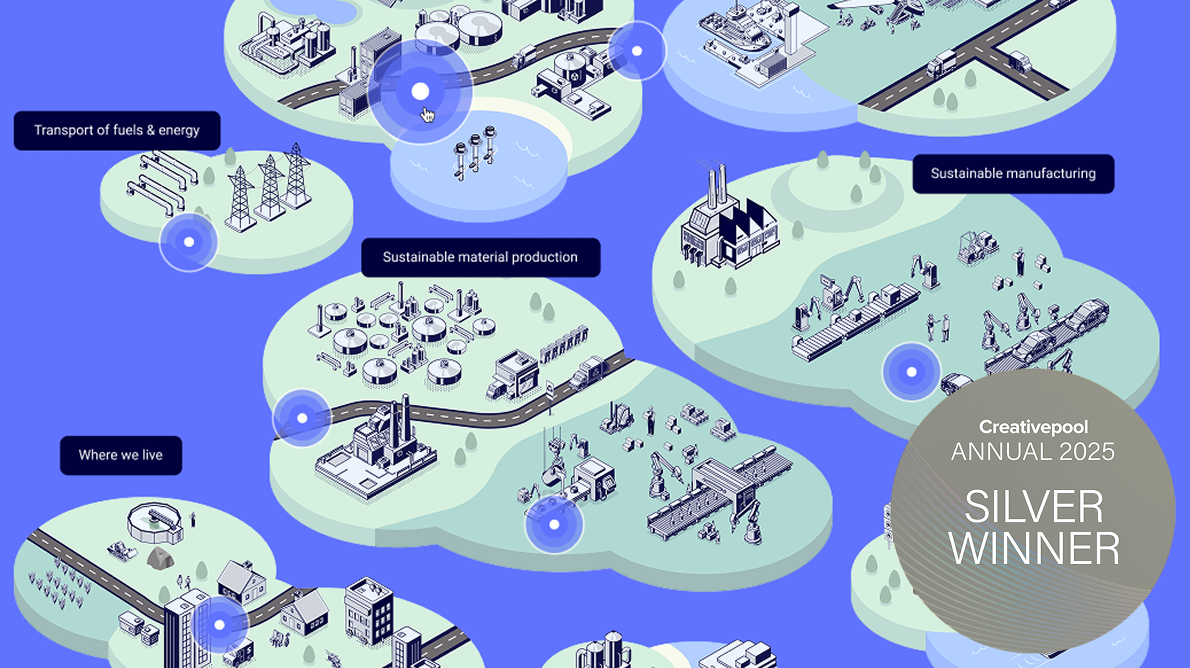
IDRIC
Development
Norwich University of the Arts
Development
Gravity
Development
Wornal Park
Digital Design
The World Bank
Campaign
Development
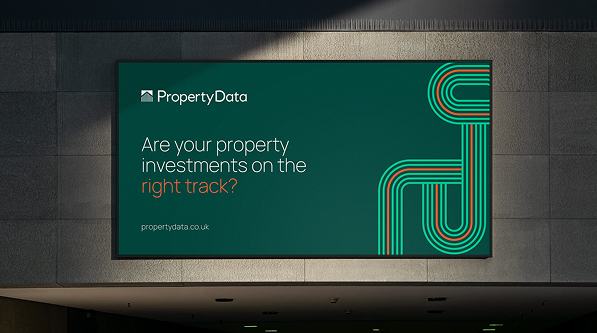
PropertyData
Campaign
Digital Design
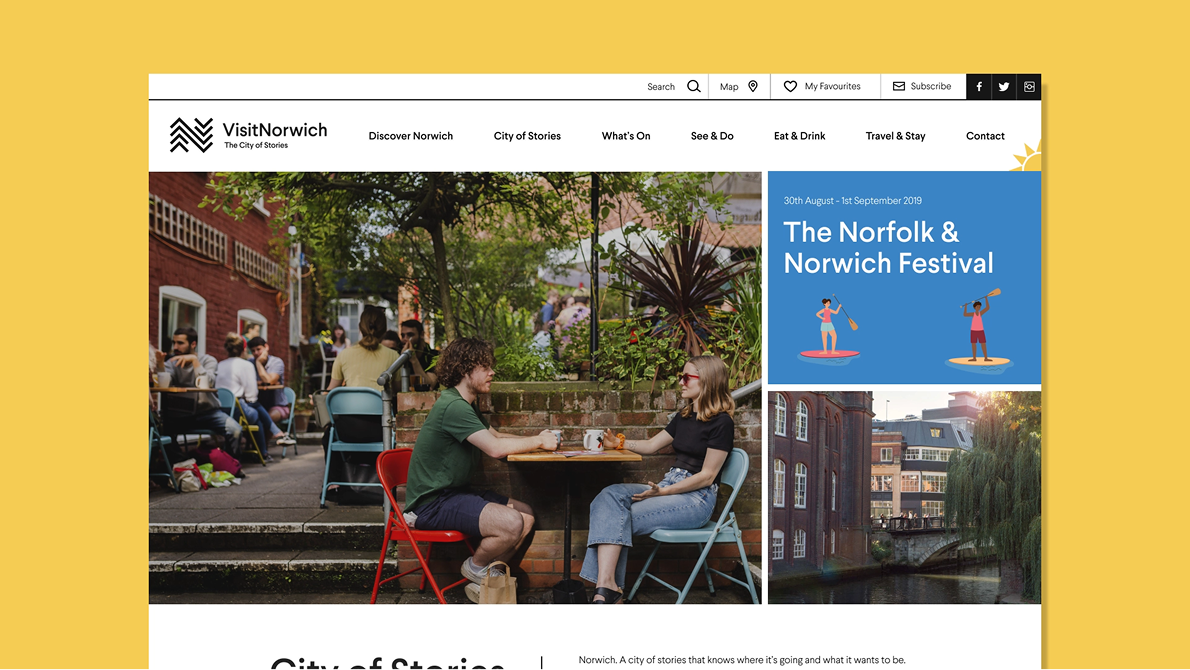
Visit Norwich
Development
TMForum
Development
The Trade
Animation
Data Vis
Ezra
Campaign
Digital Design
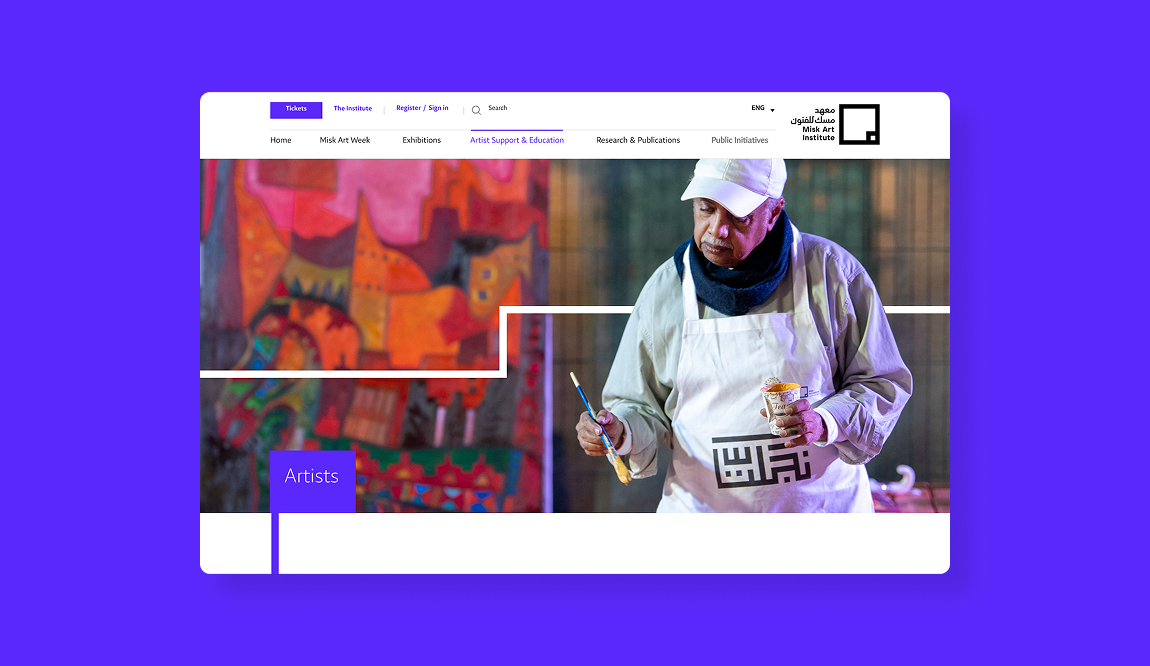
Misk Art Institute
Development
University of York
Data Vis
Digital Design
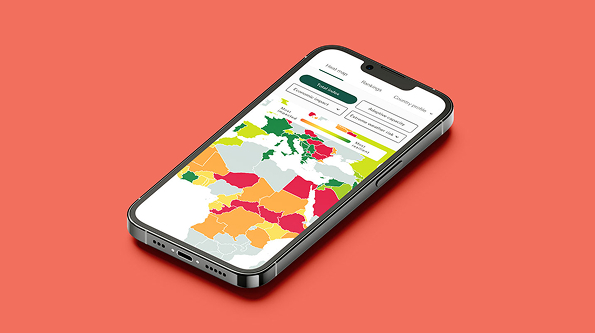
UNFPA SWEDD+
Animation
Data Vis
TotalJobs
Development
Digital Design
Swiss RE
Data Vis
Development
Climate Change Committee
Animation
Campaign
The Royal Society
Animation
Digital Design
Betfred
Development