Data visualisation agency
Most businesses and organisations possess data that should drive decisions, support arguments, and influence opinions. We transform it into information people can truly understand.

Your data has a voice;
it's time the world listened.
Logos


Trusted across sectors
Financial Services / Healthcare / Government & Public Sector / Non-Profit & NGOs / Technology / Professional Services / Research & Education / Energy & Utilities / Telecoms
Data is only as valuable as the clarity with which it communicates.
Numbers alone do not persuade; stories do. Soak combines strategic thinking, creative design and technical rigour to create data visualisations that communicate, convince and endure.
We partner with organisations managing complex information and research. Whether you need a real-time dashboard, an interactive report to showcase impact, or a tool that empowers your audience, our solutions deliver.
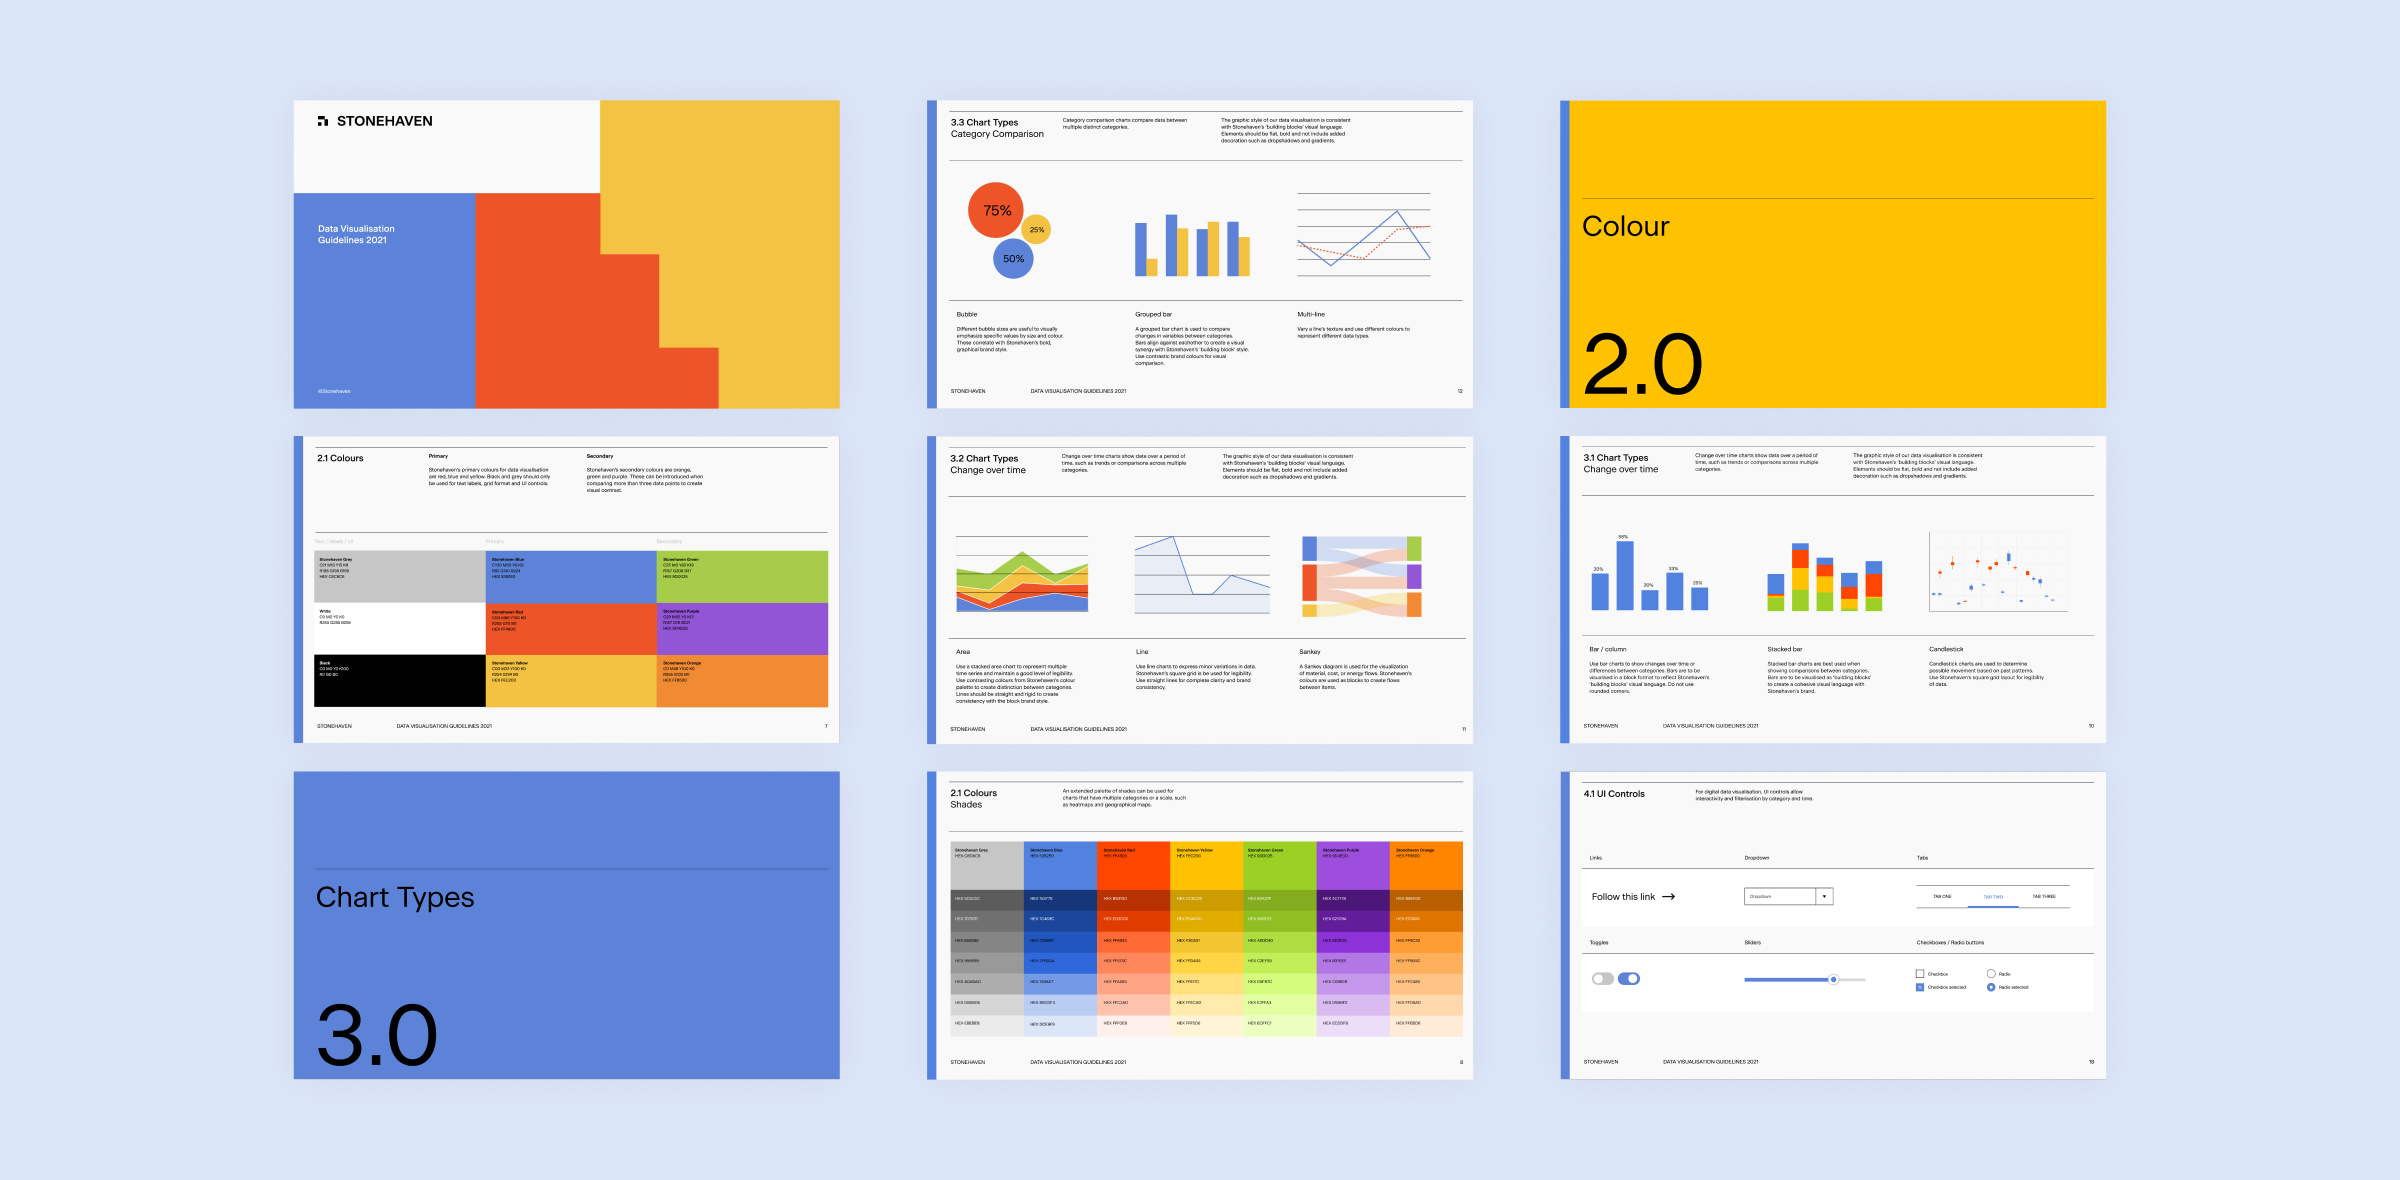
Seven core disciplines.
One consistent standard.
Every format serves a different purpose. We match the right output to your audience, data, and objectives.
- 01
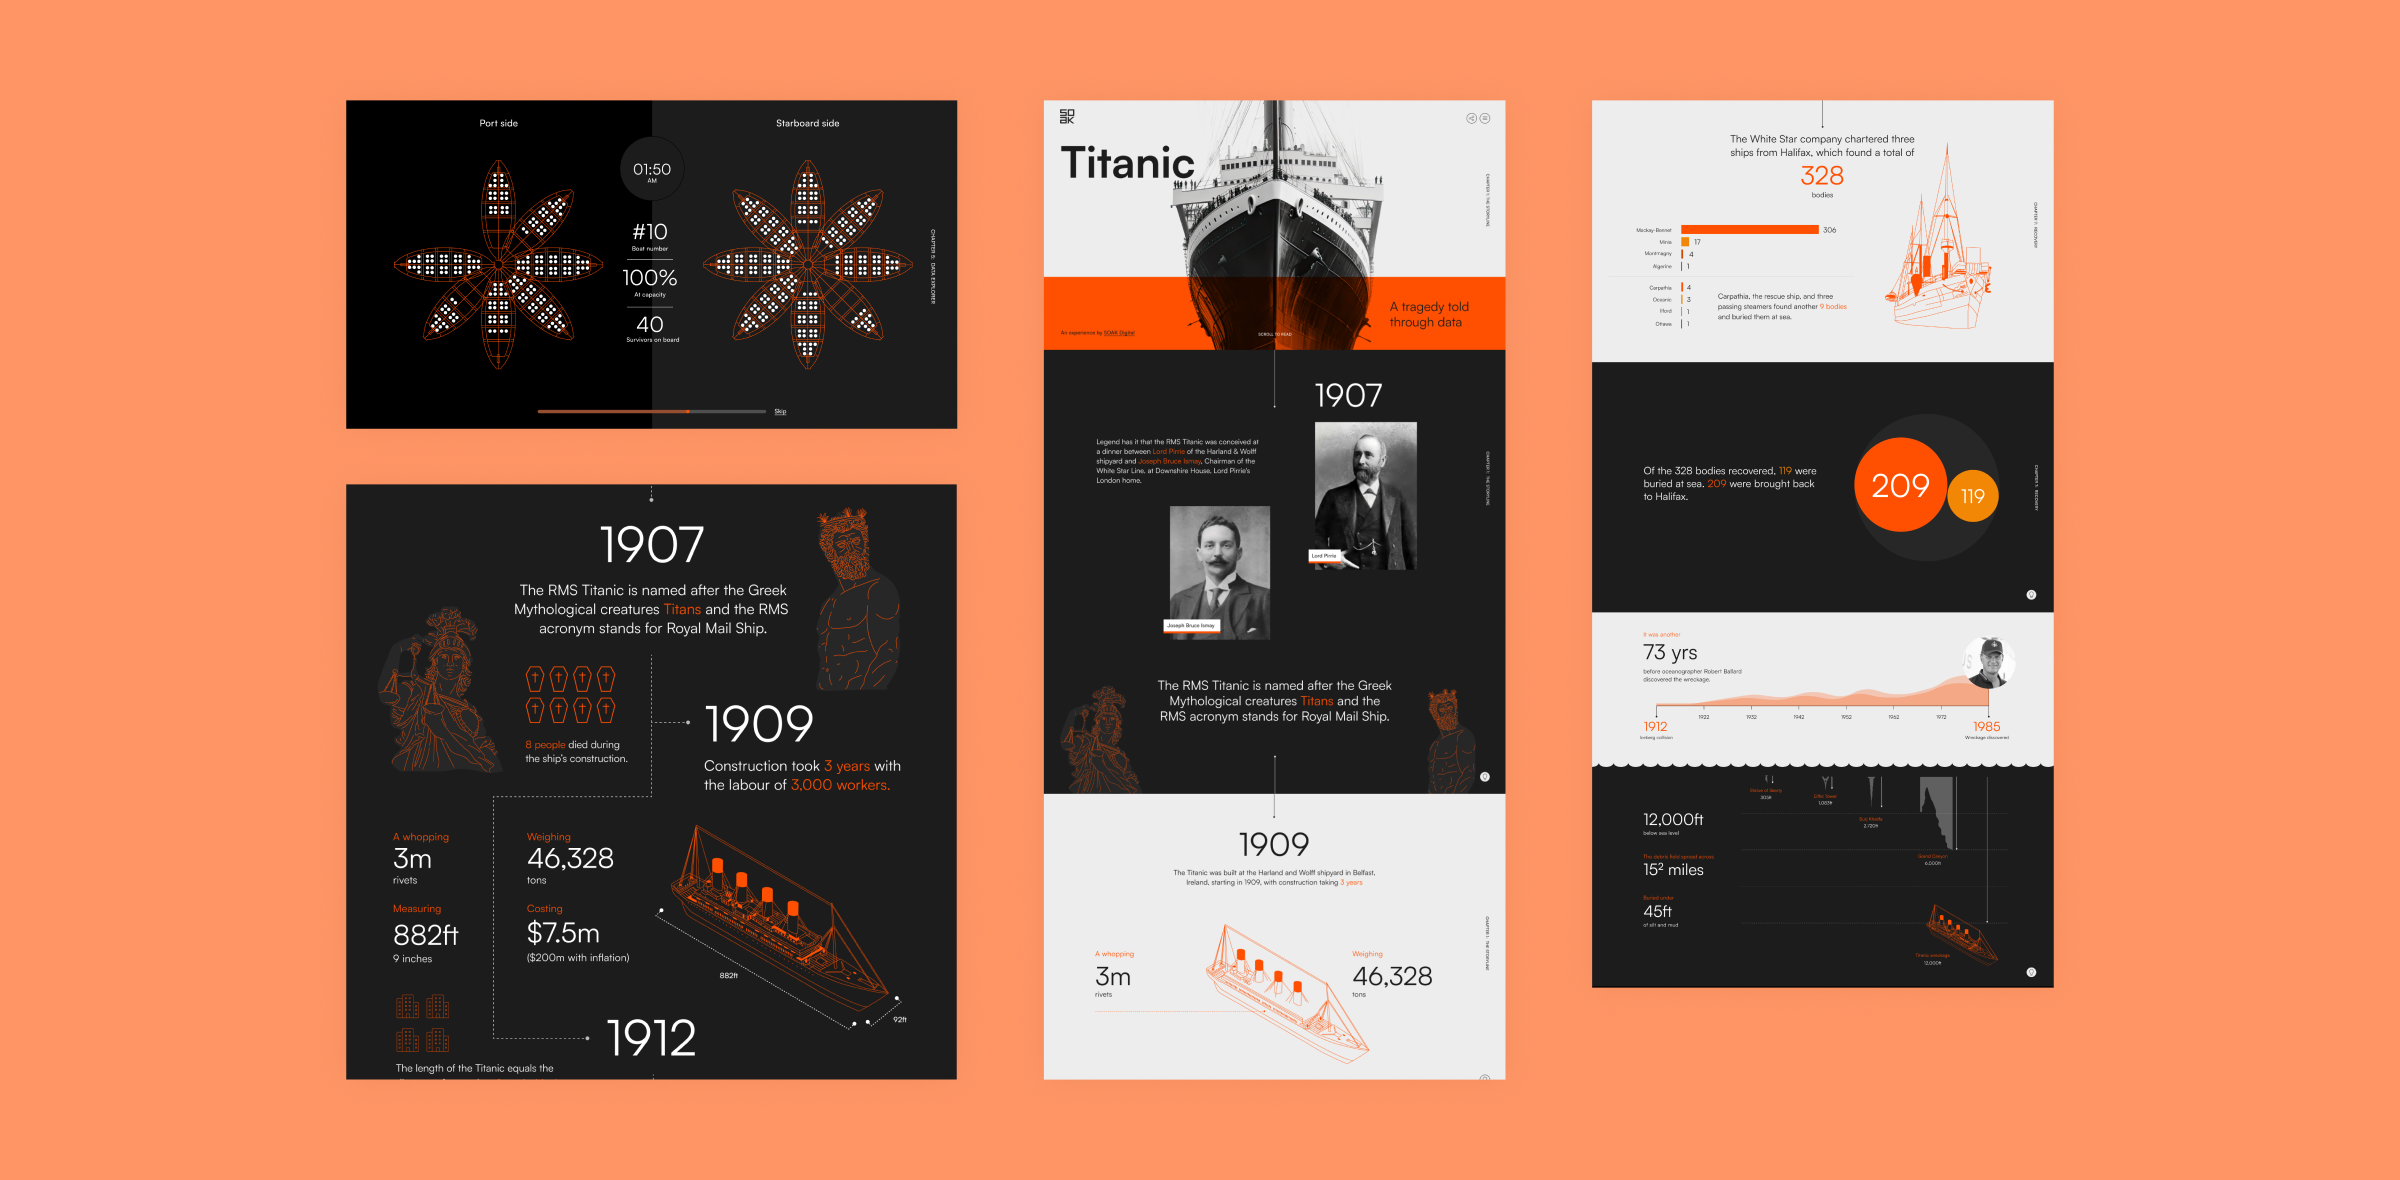
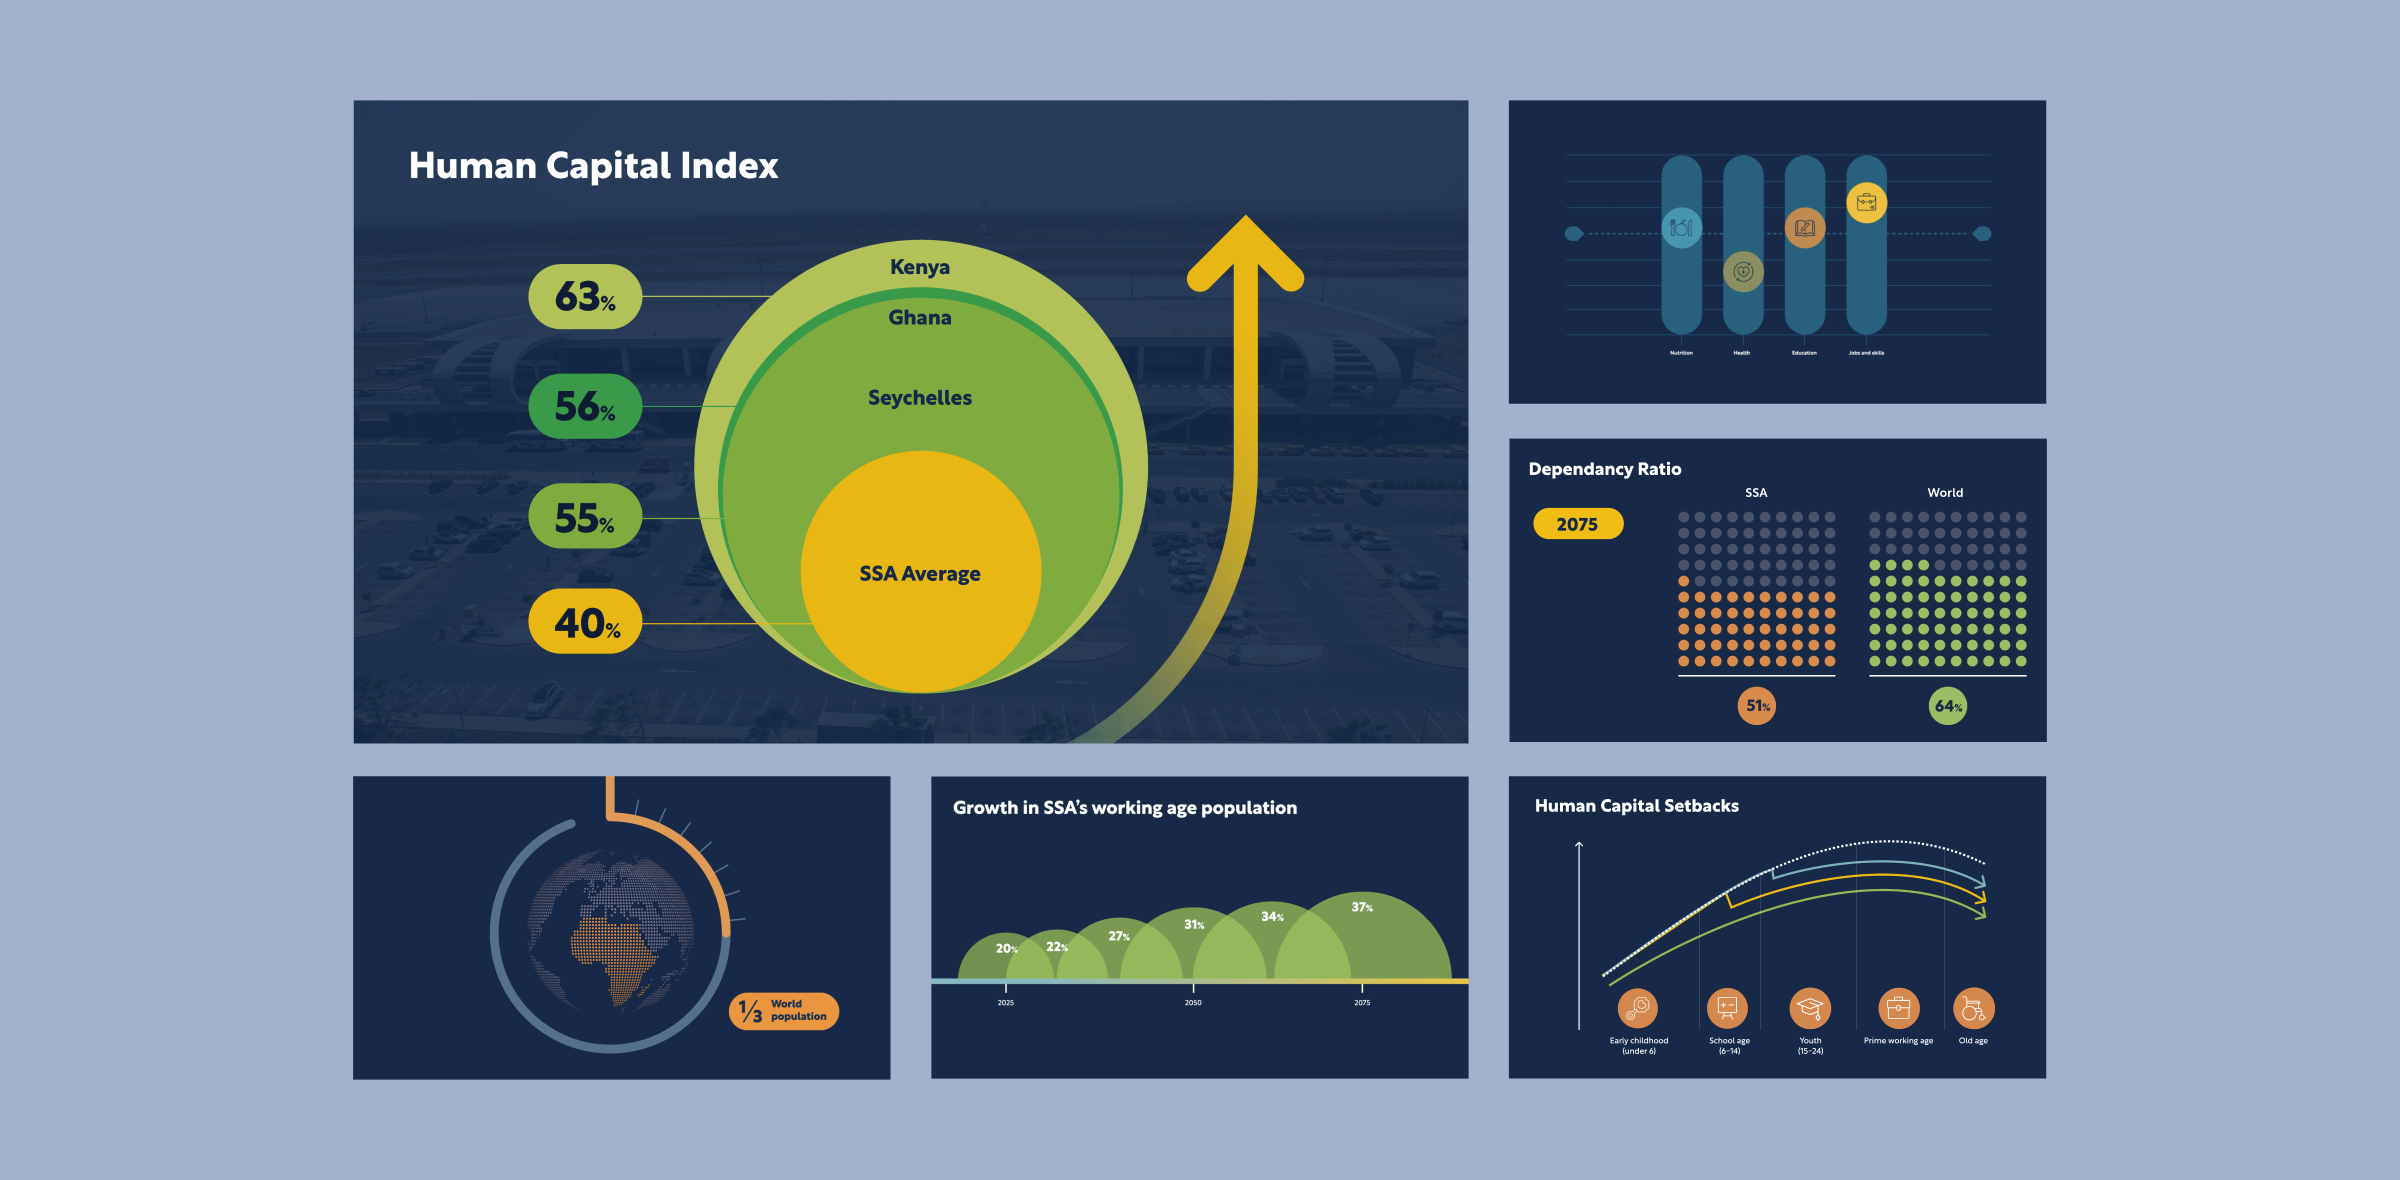
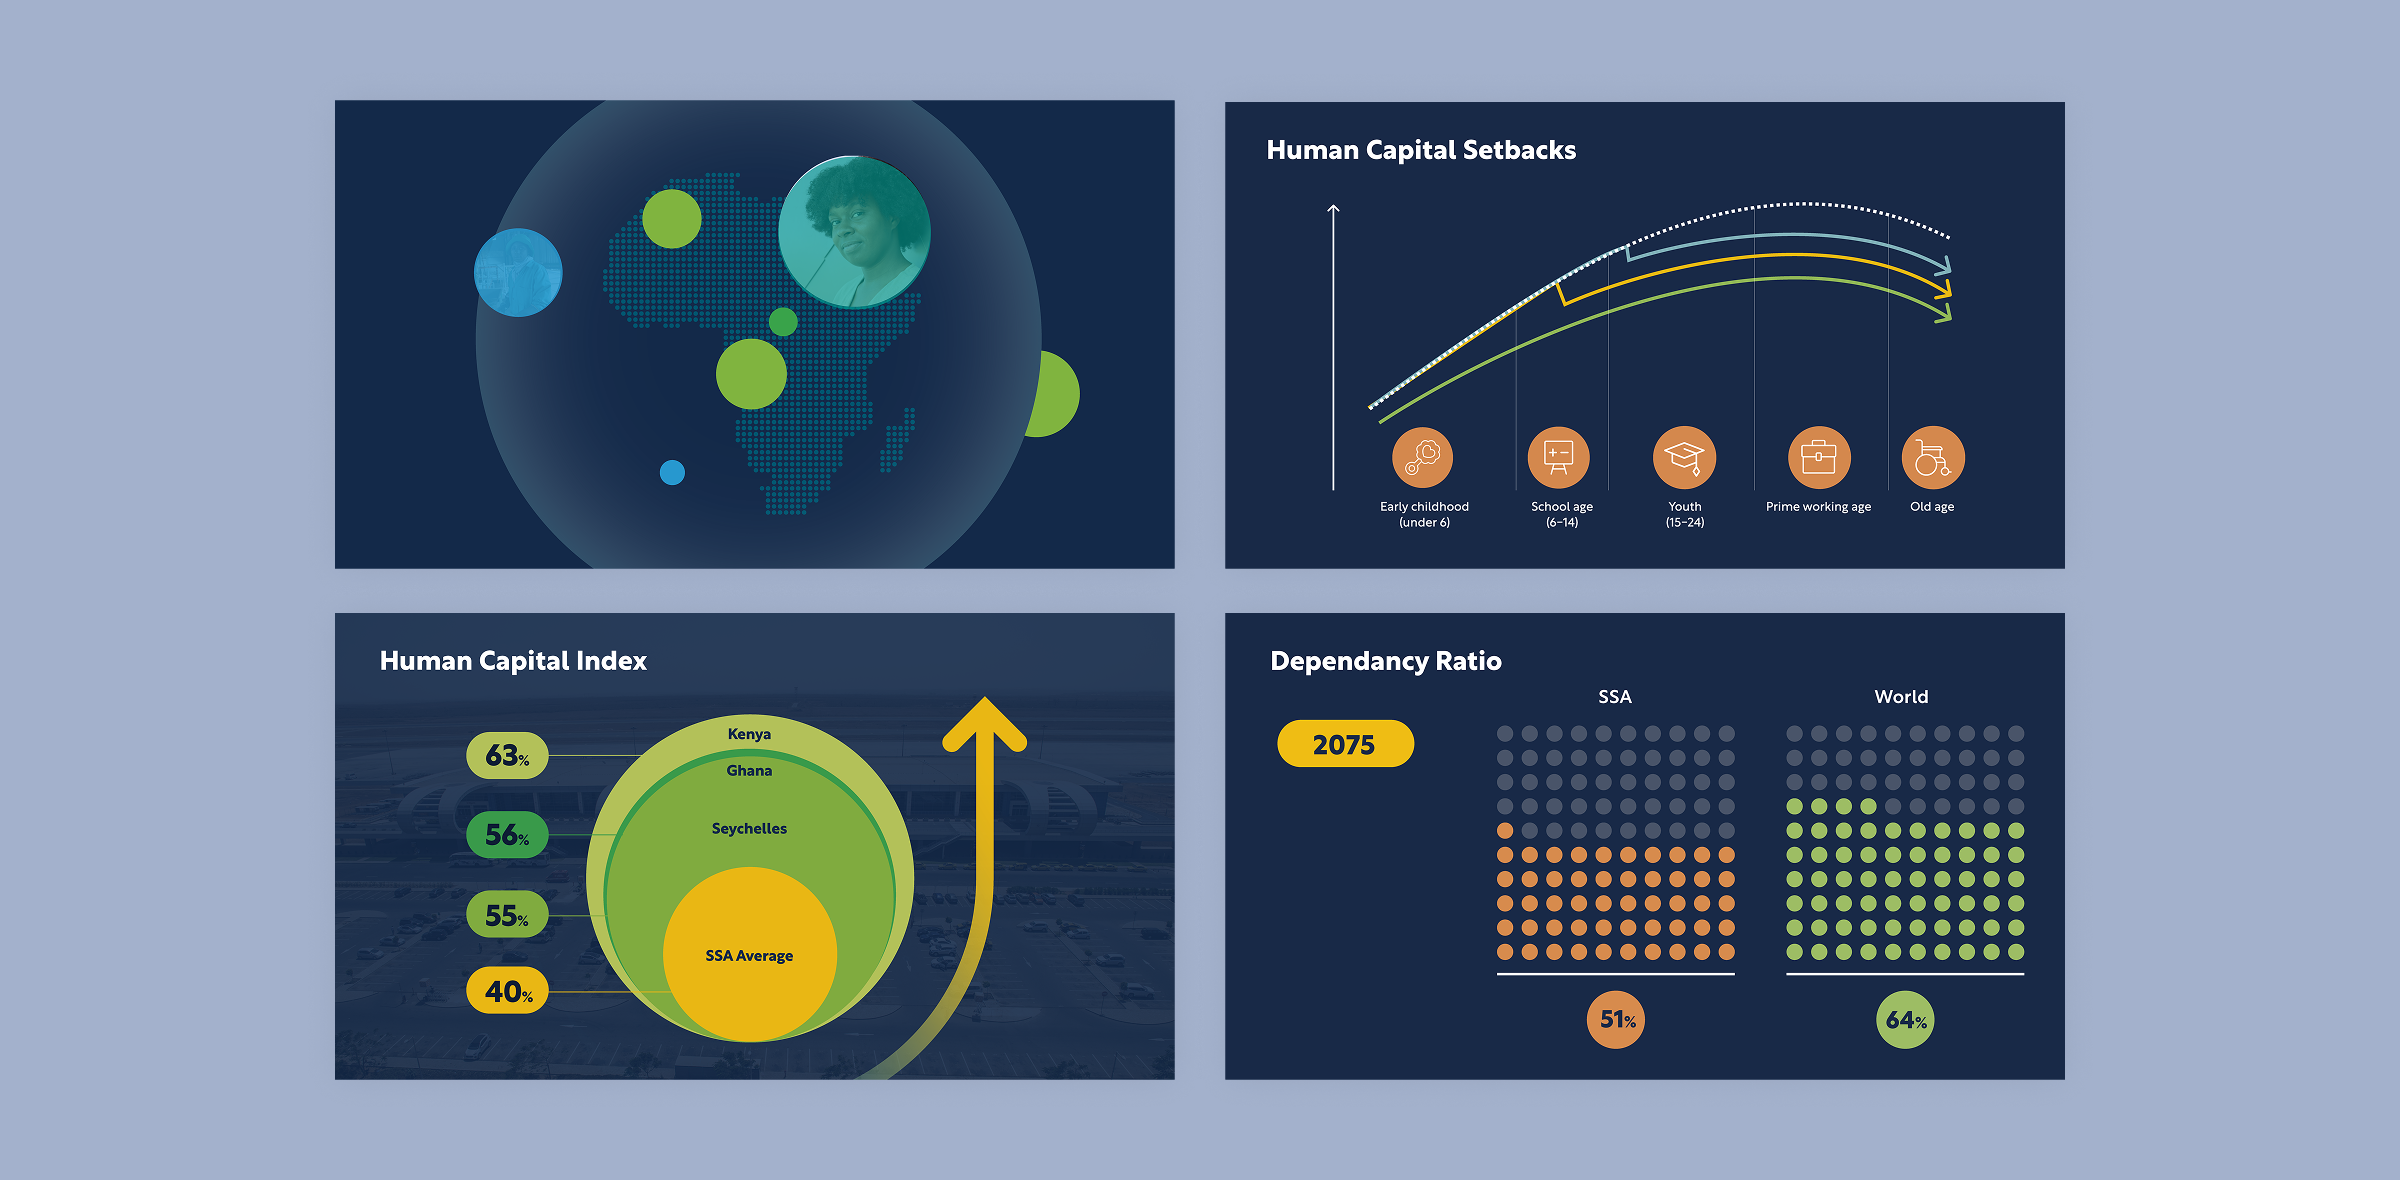
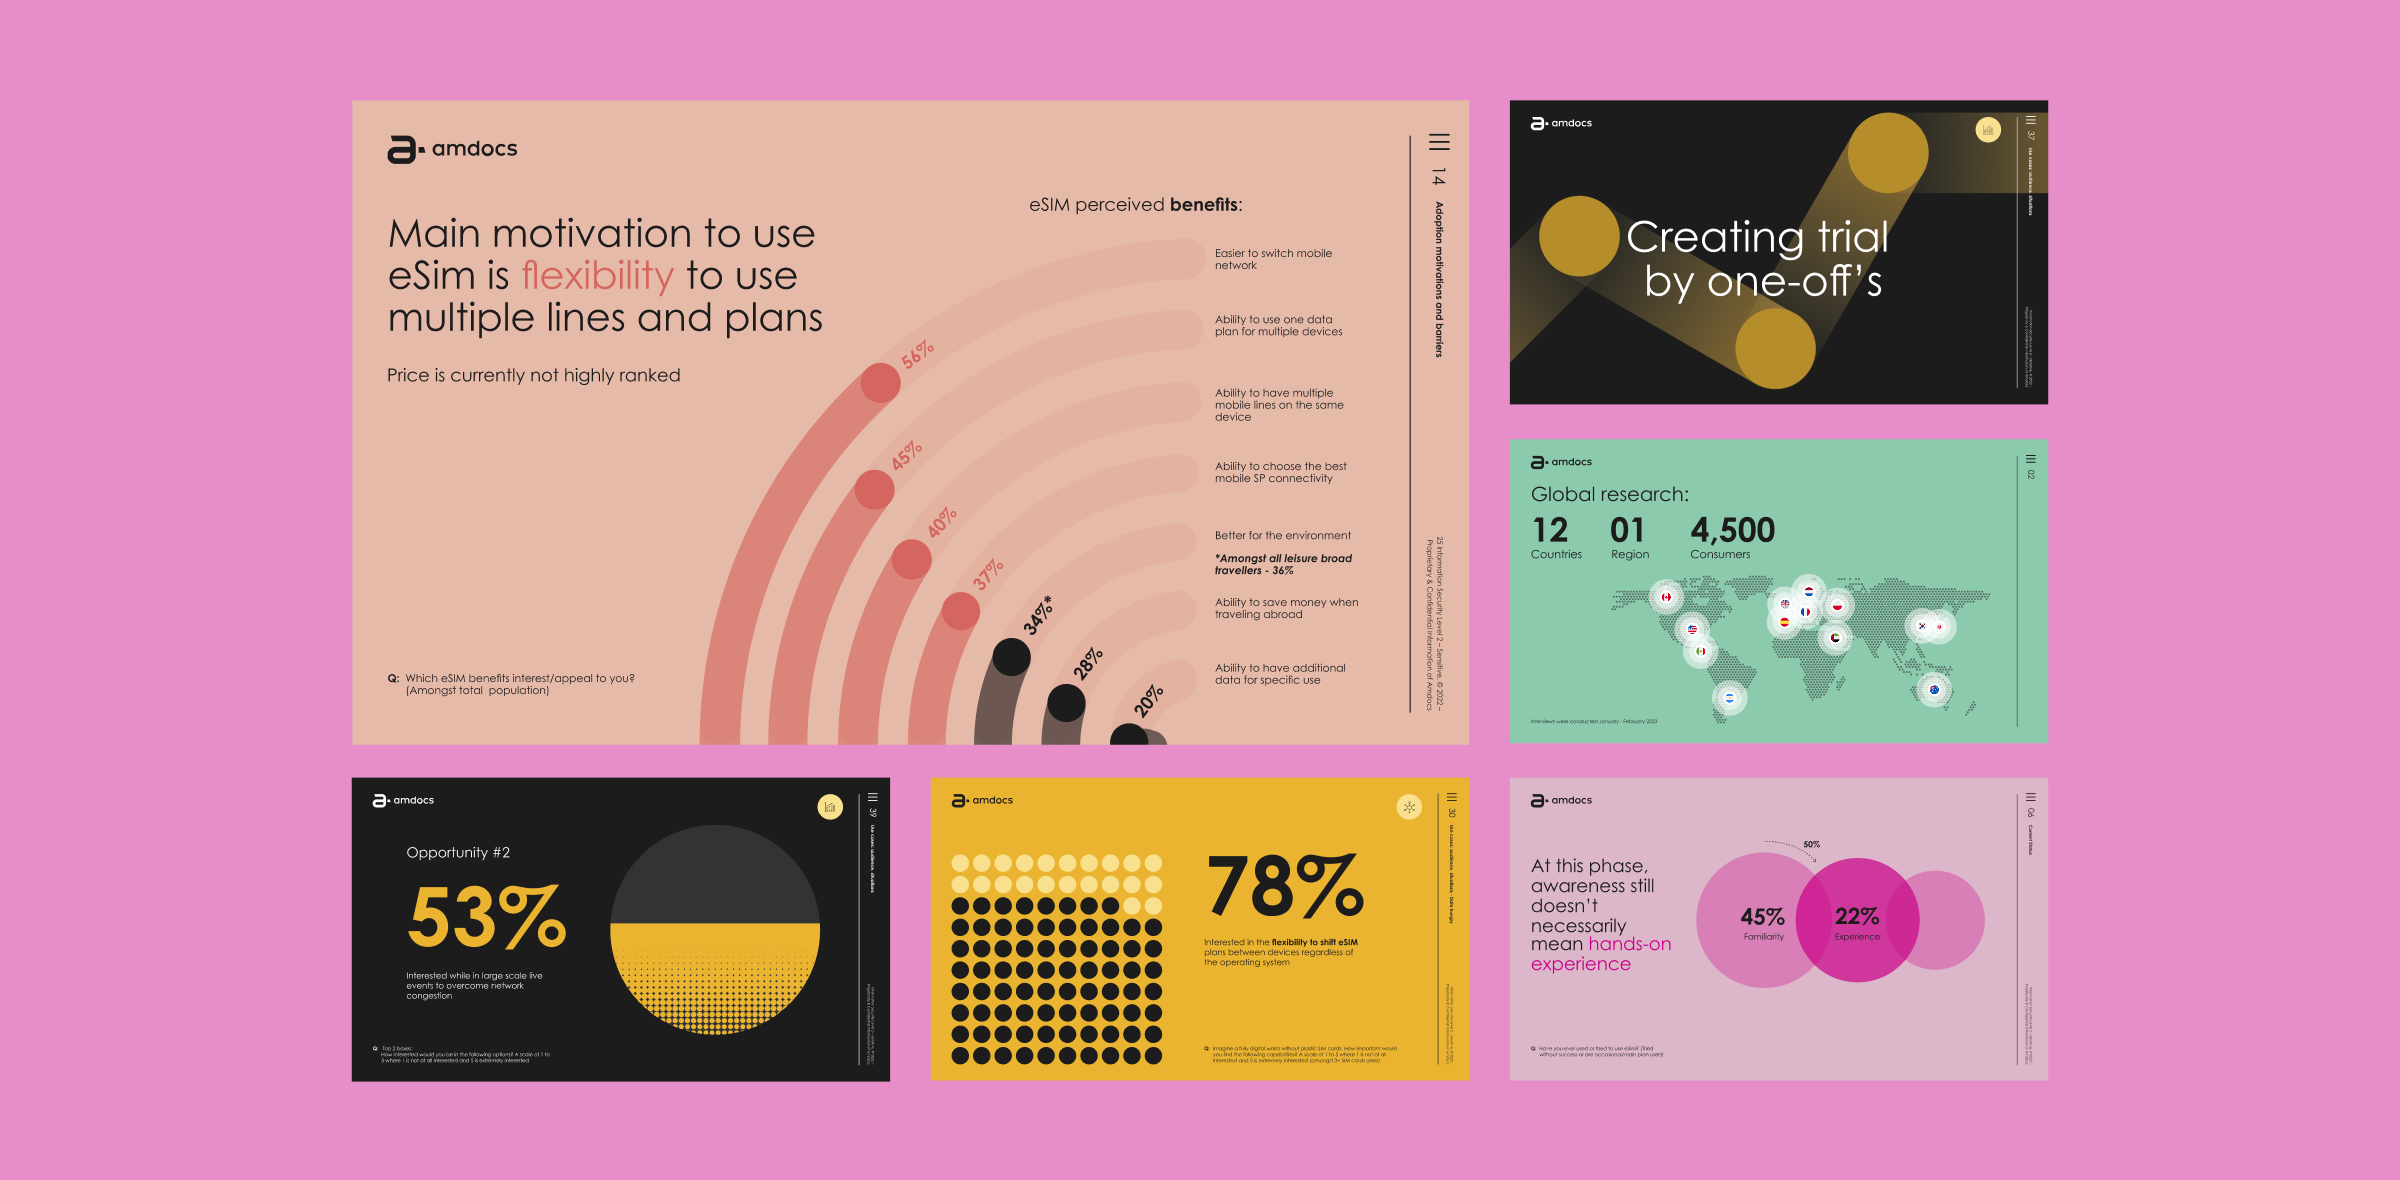
Infographics
Bespoke, infographics that communicate complex information quickly and credibly. Used within websites, reports, presentations and socials.
- 02
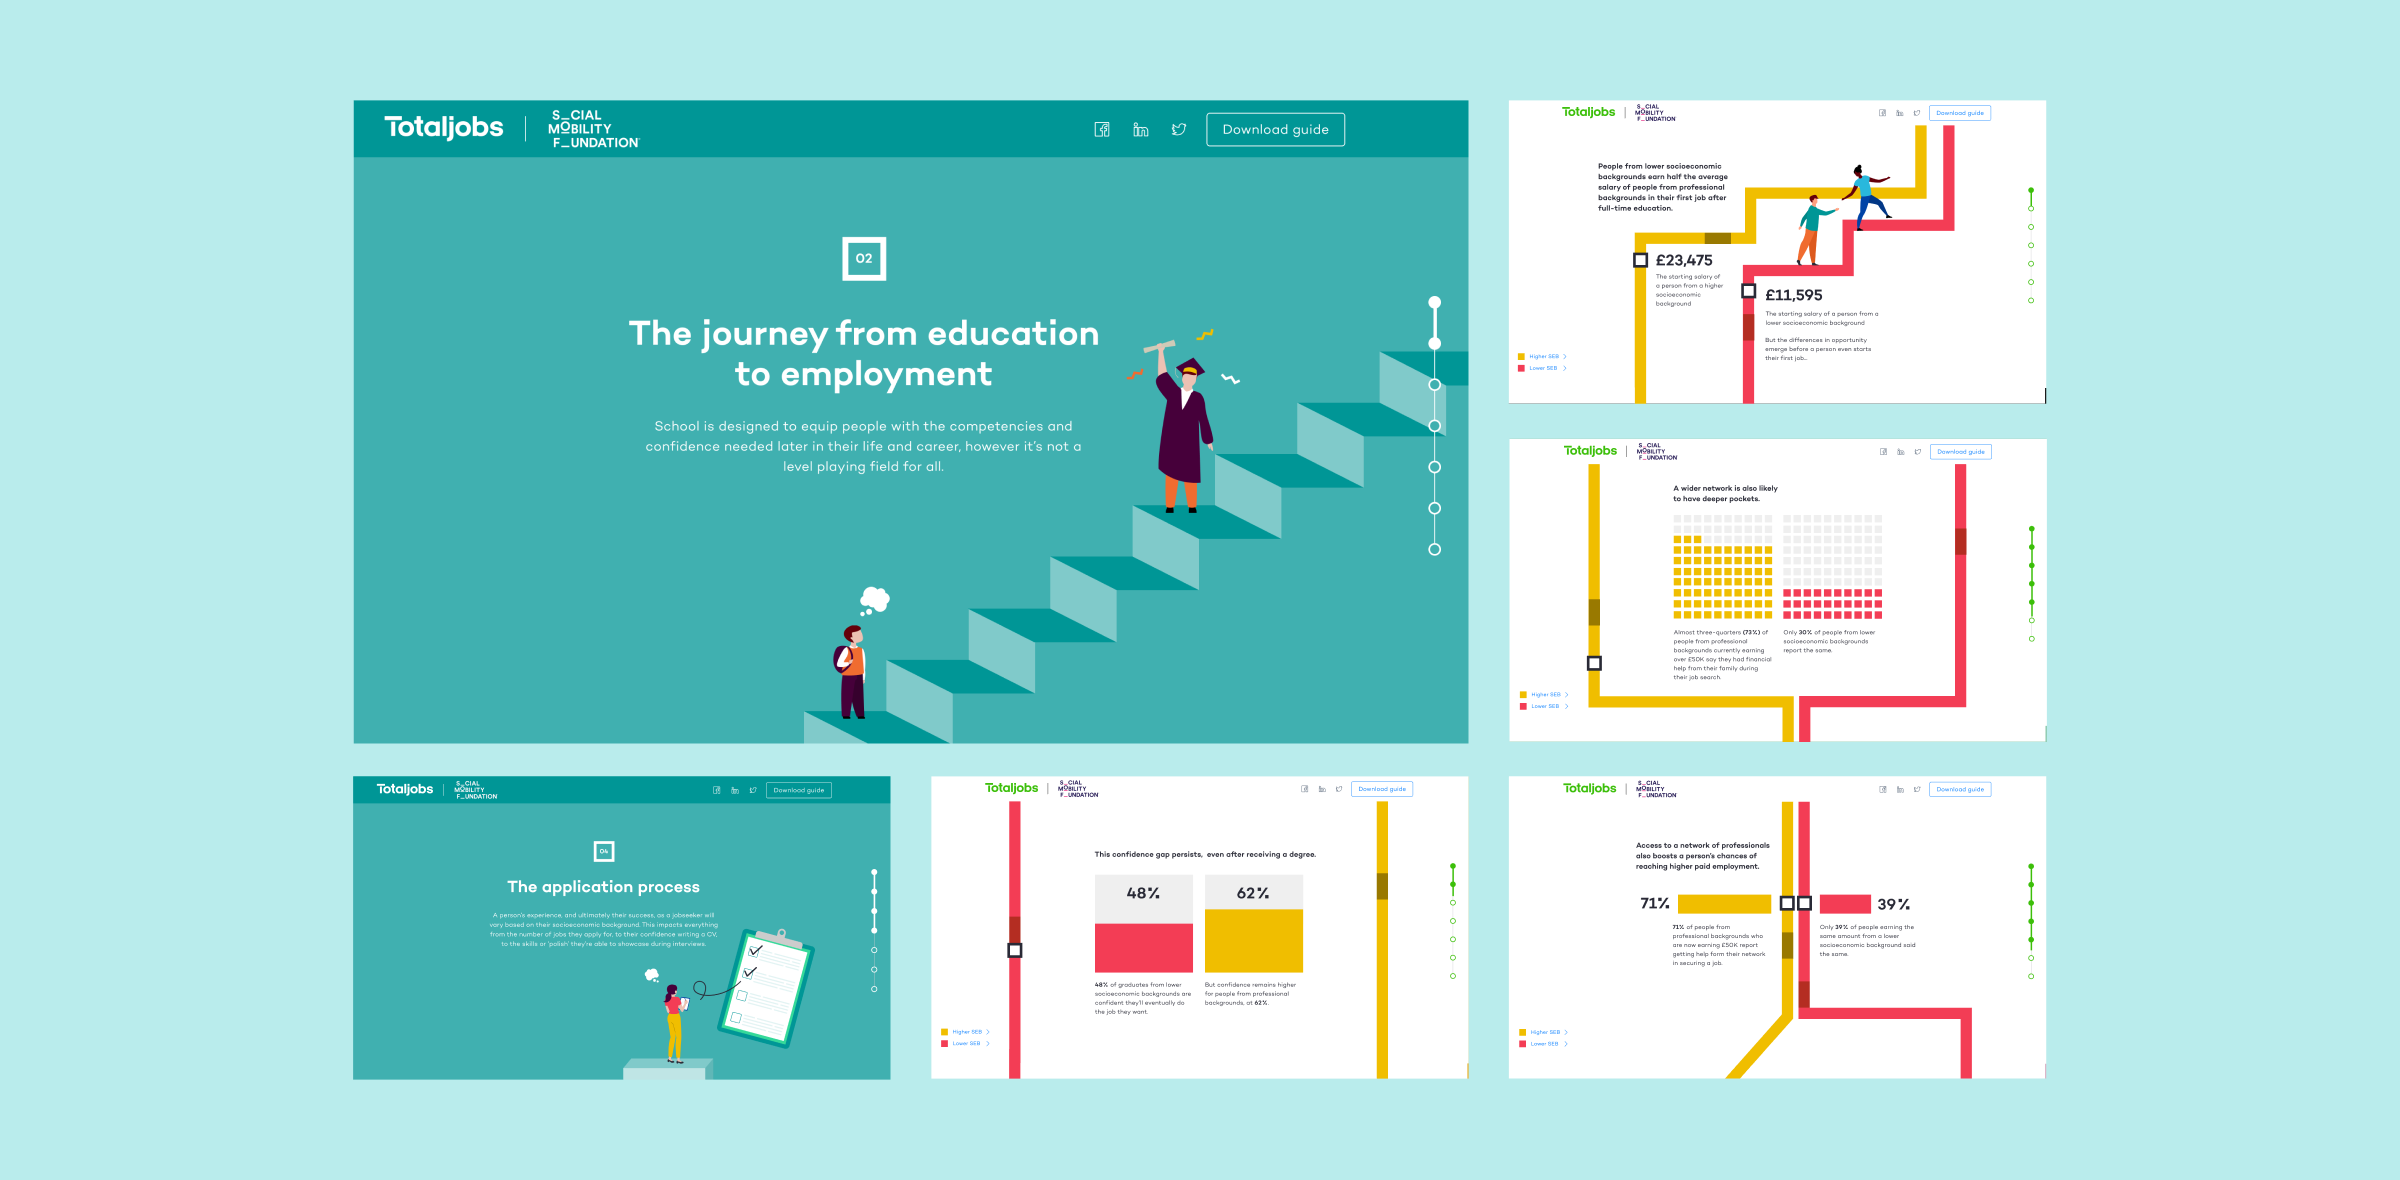
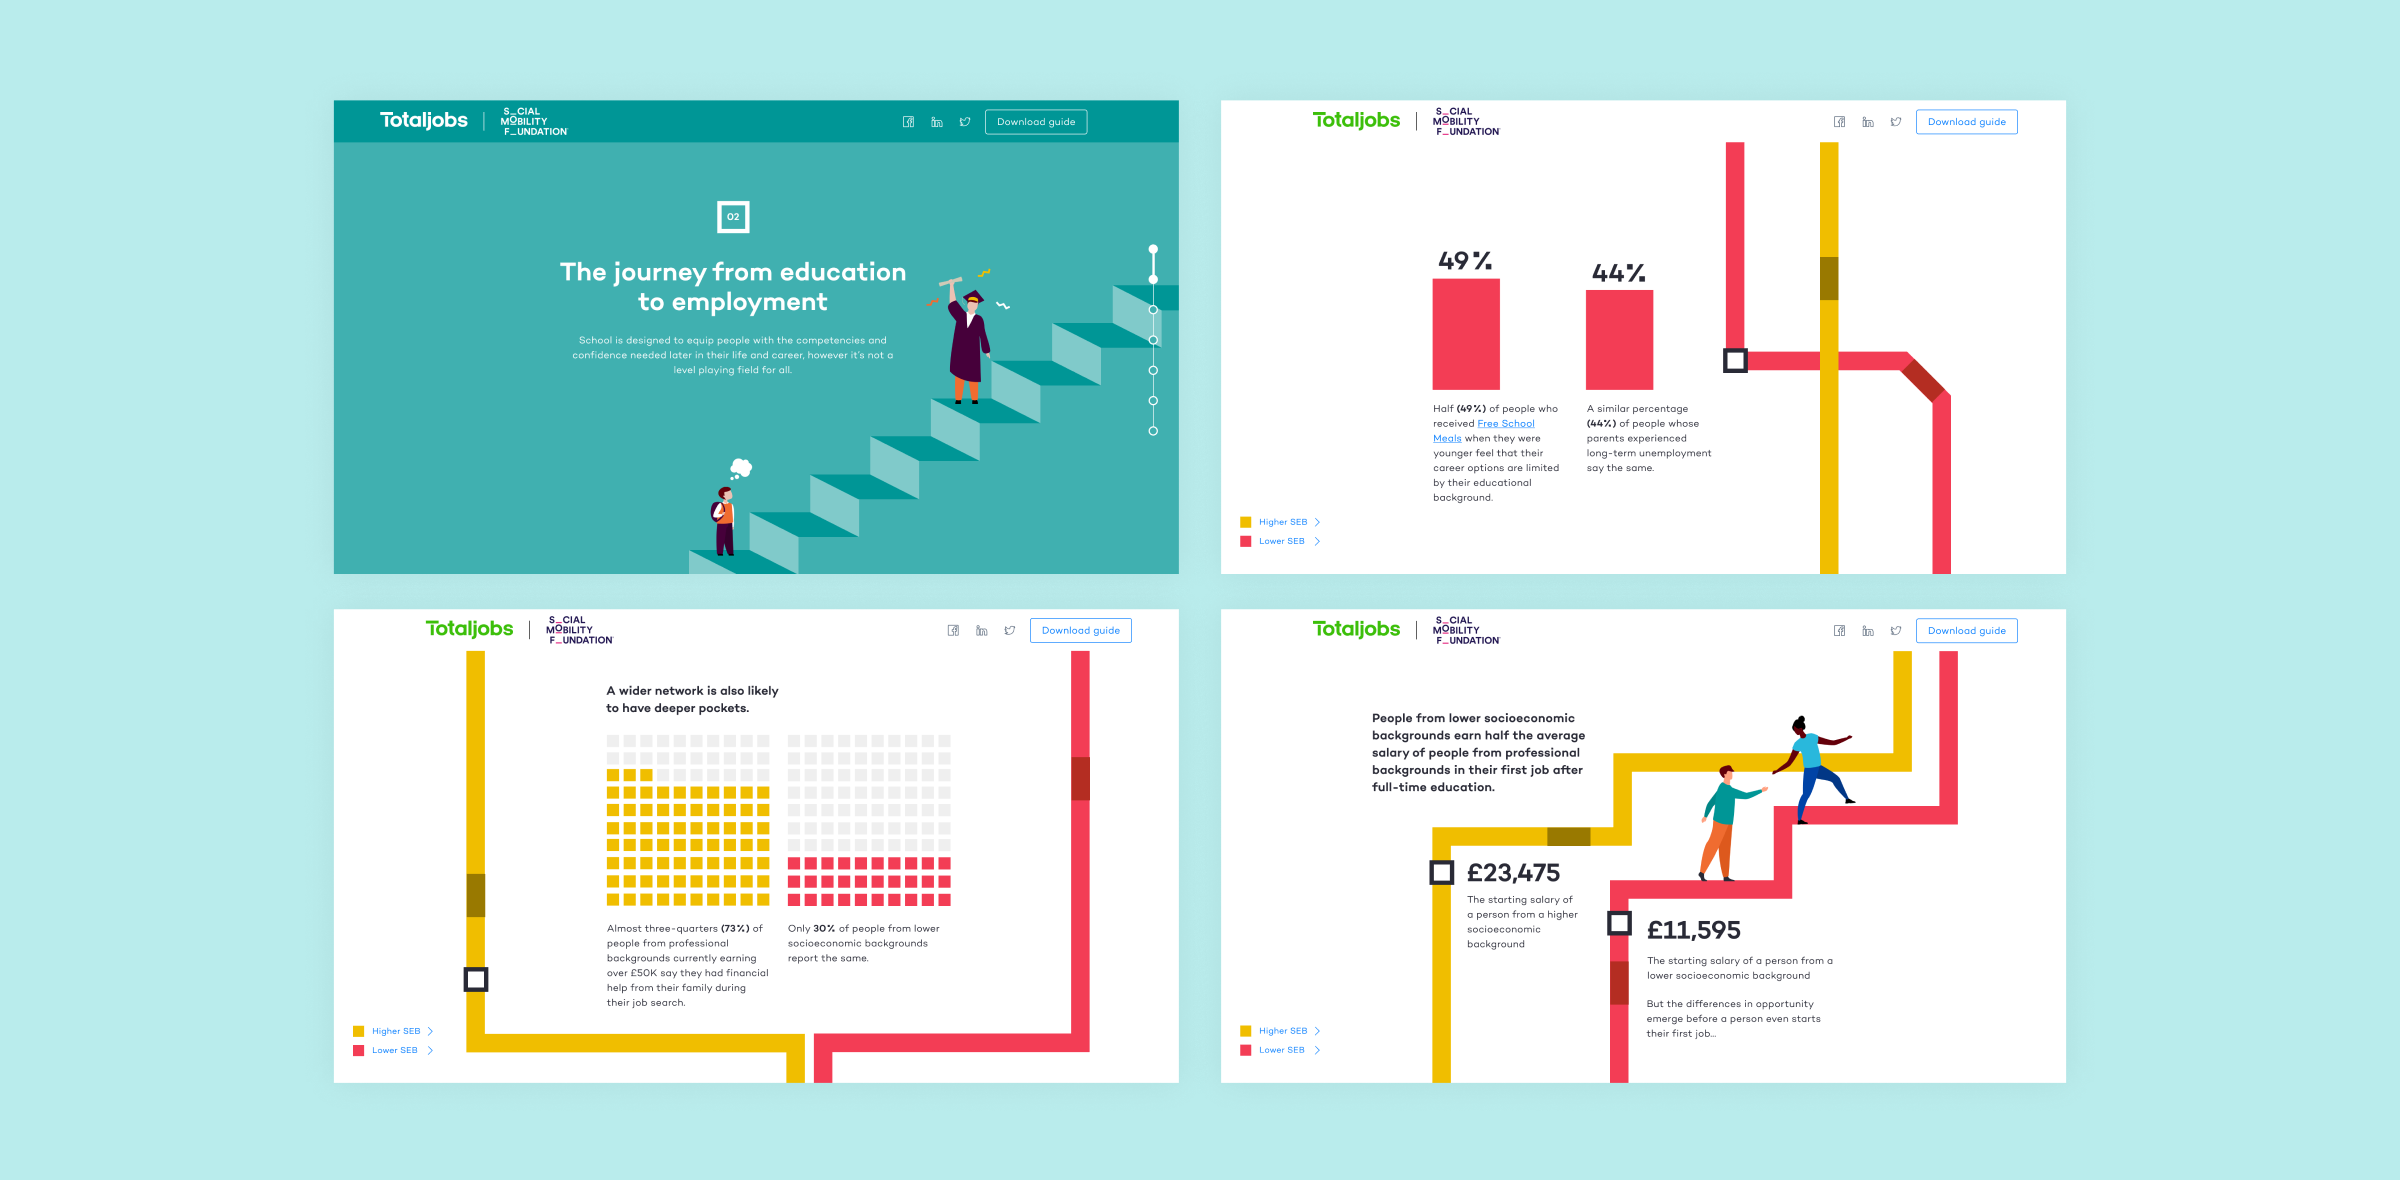
Interactive reports
Digital reports that go way beyond the humble PDF. Readers can explore data at their own pace, filter by relevance and draw their own conclusions, all within an immersive, accessible experience.
- 03
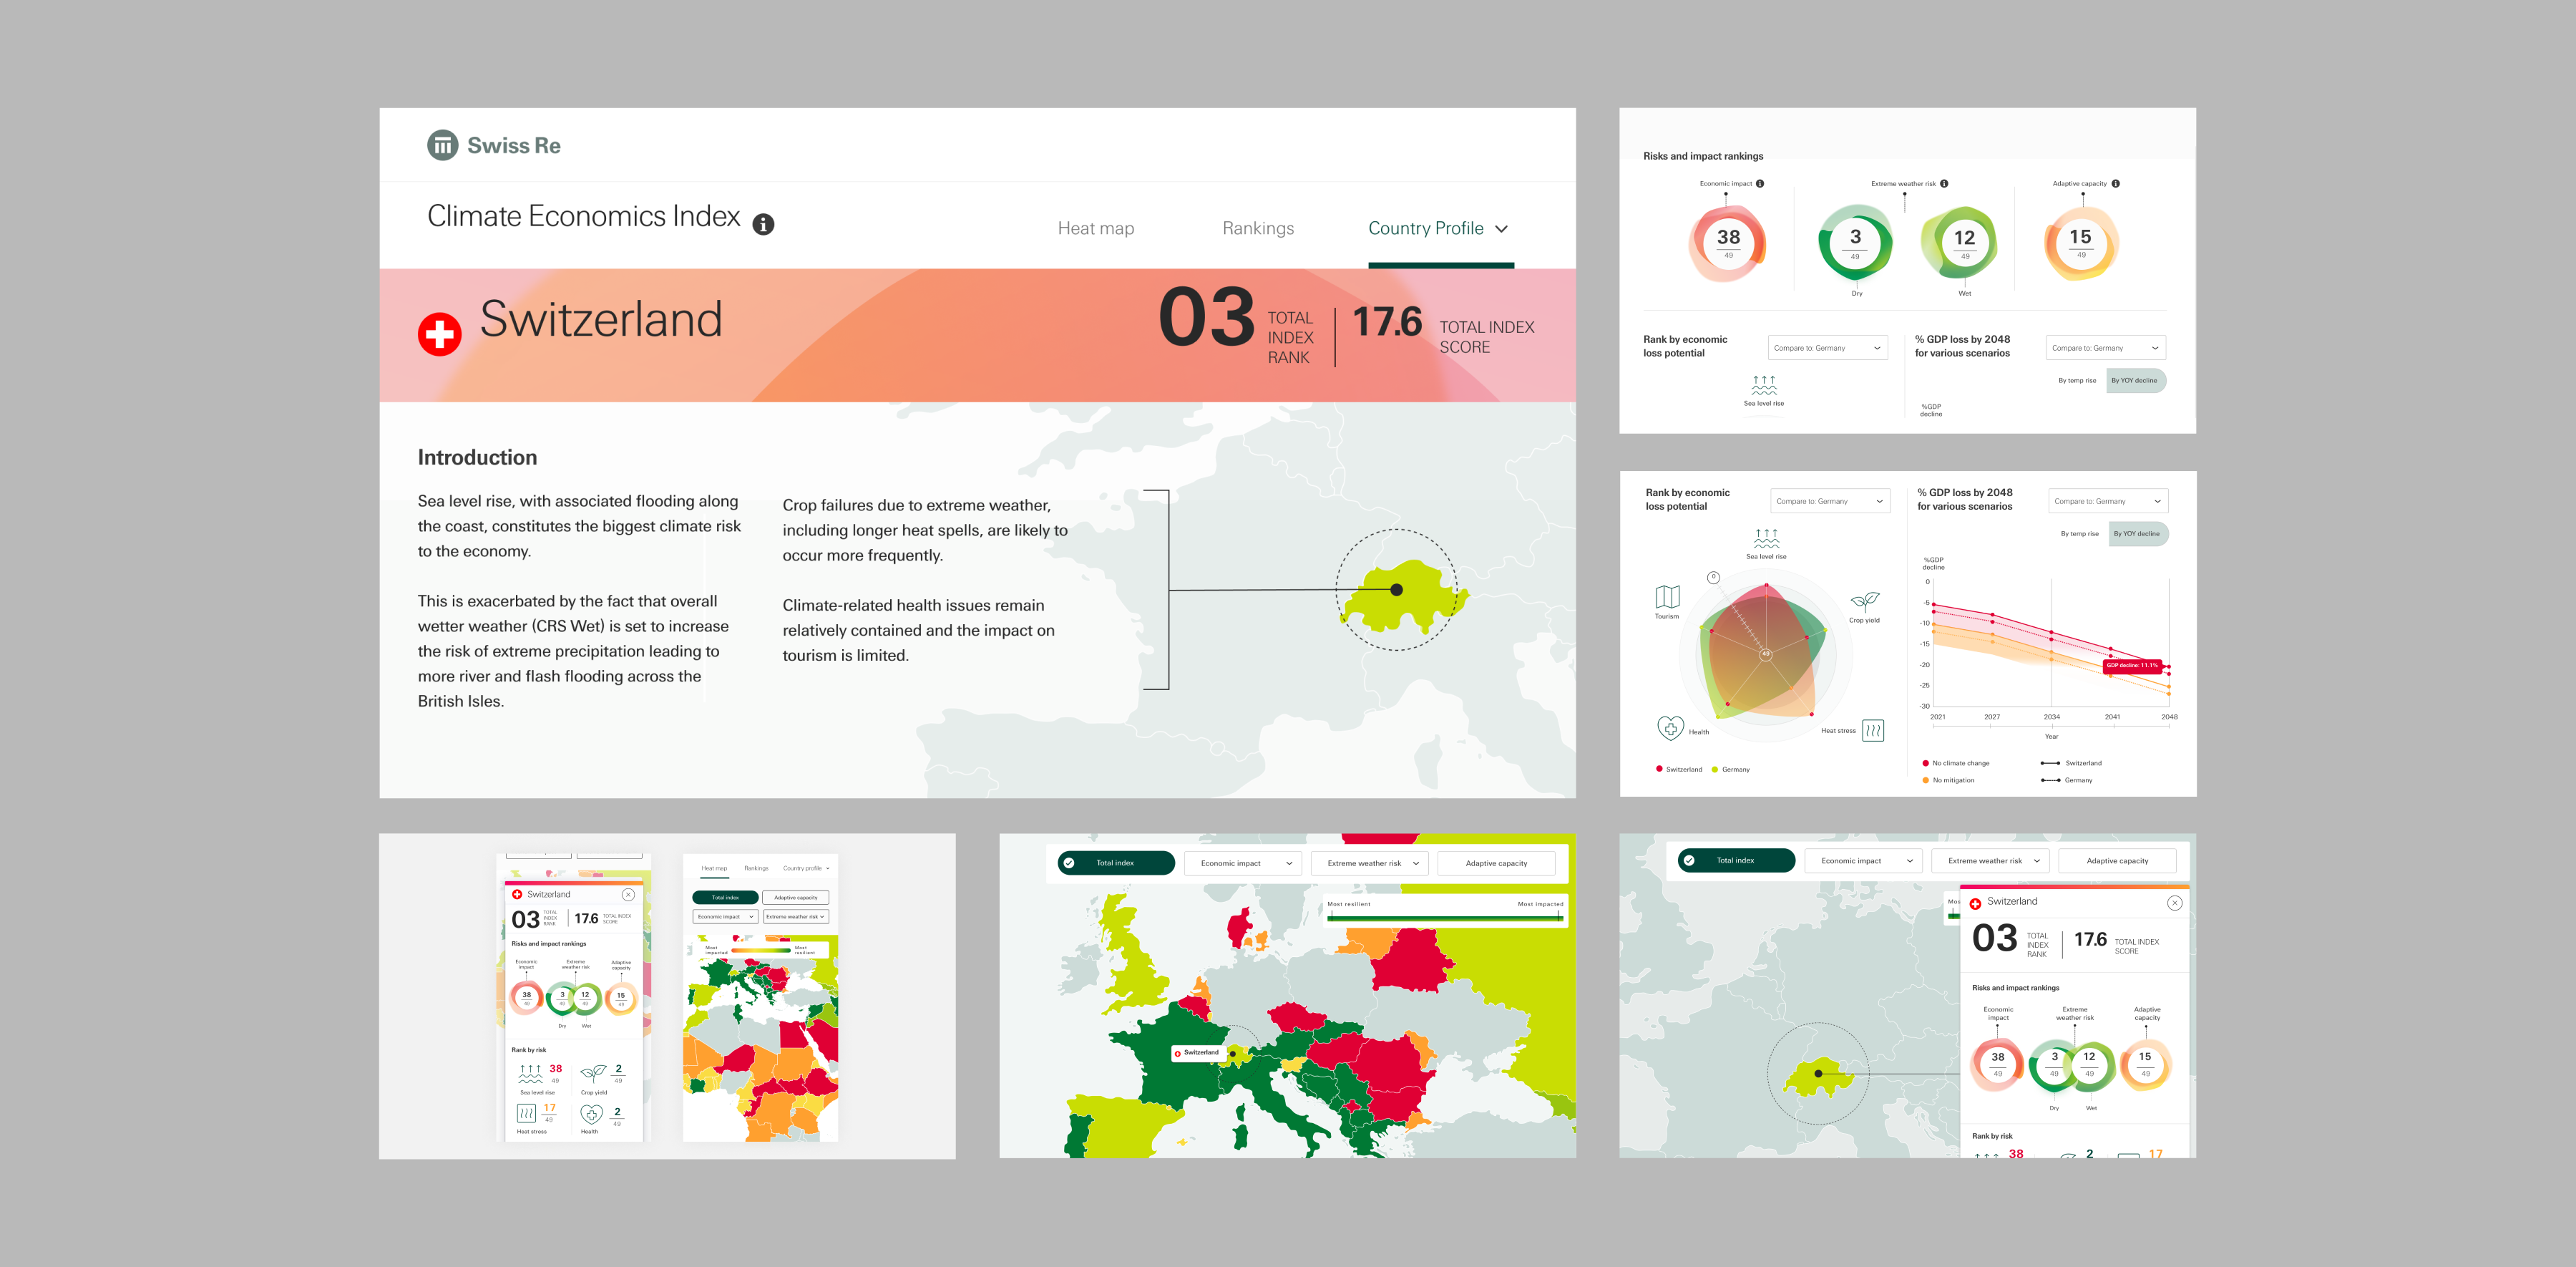
Dashboards
Interactive dashboards that connect to your data sources and refresh automatically. Designed for decision-makers who need accurate information instantly.
- 04
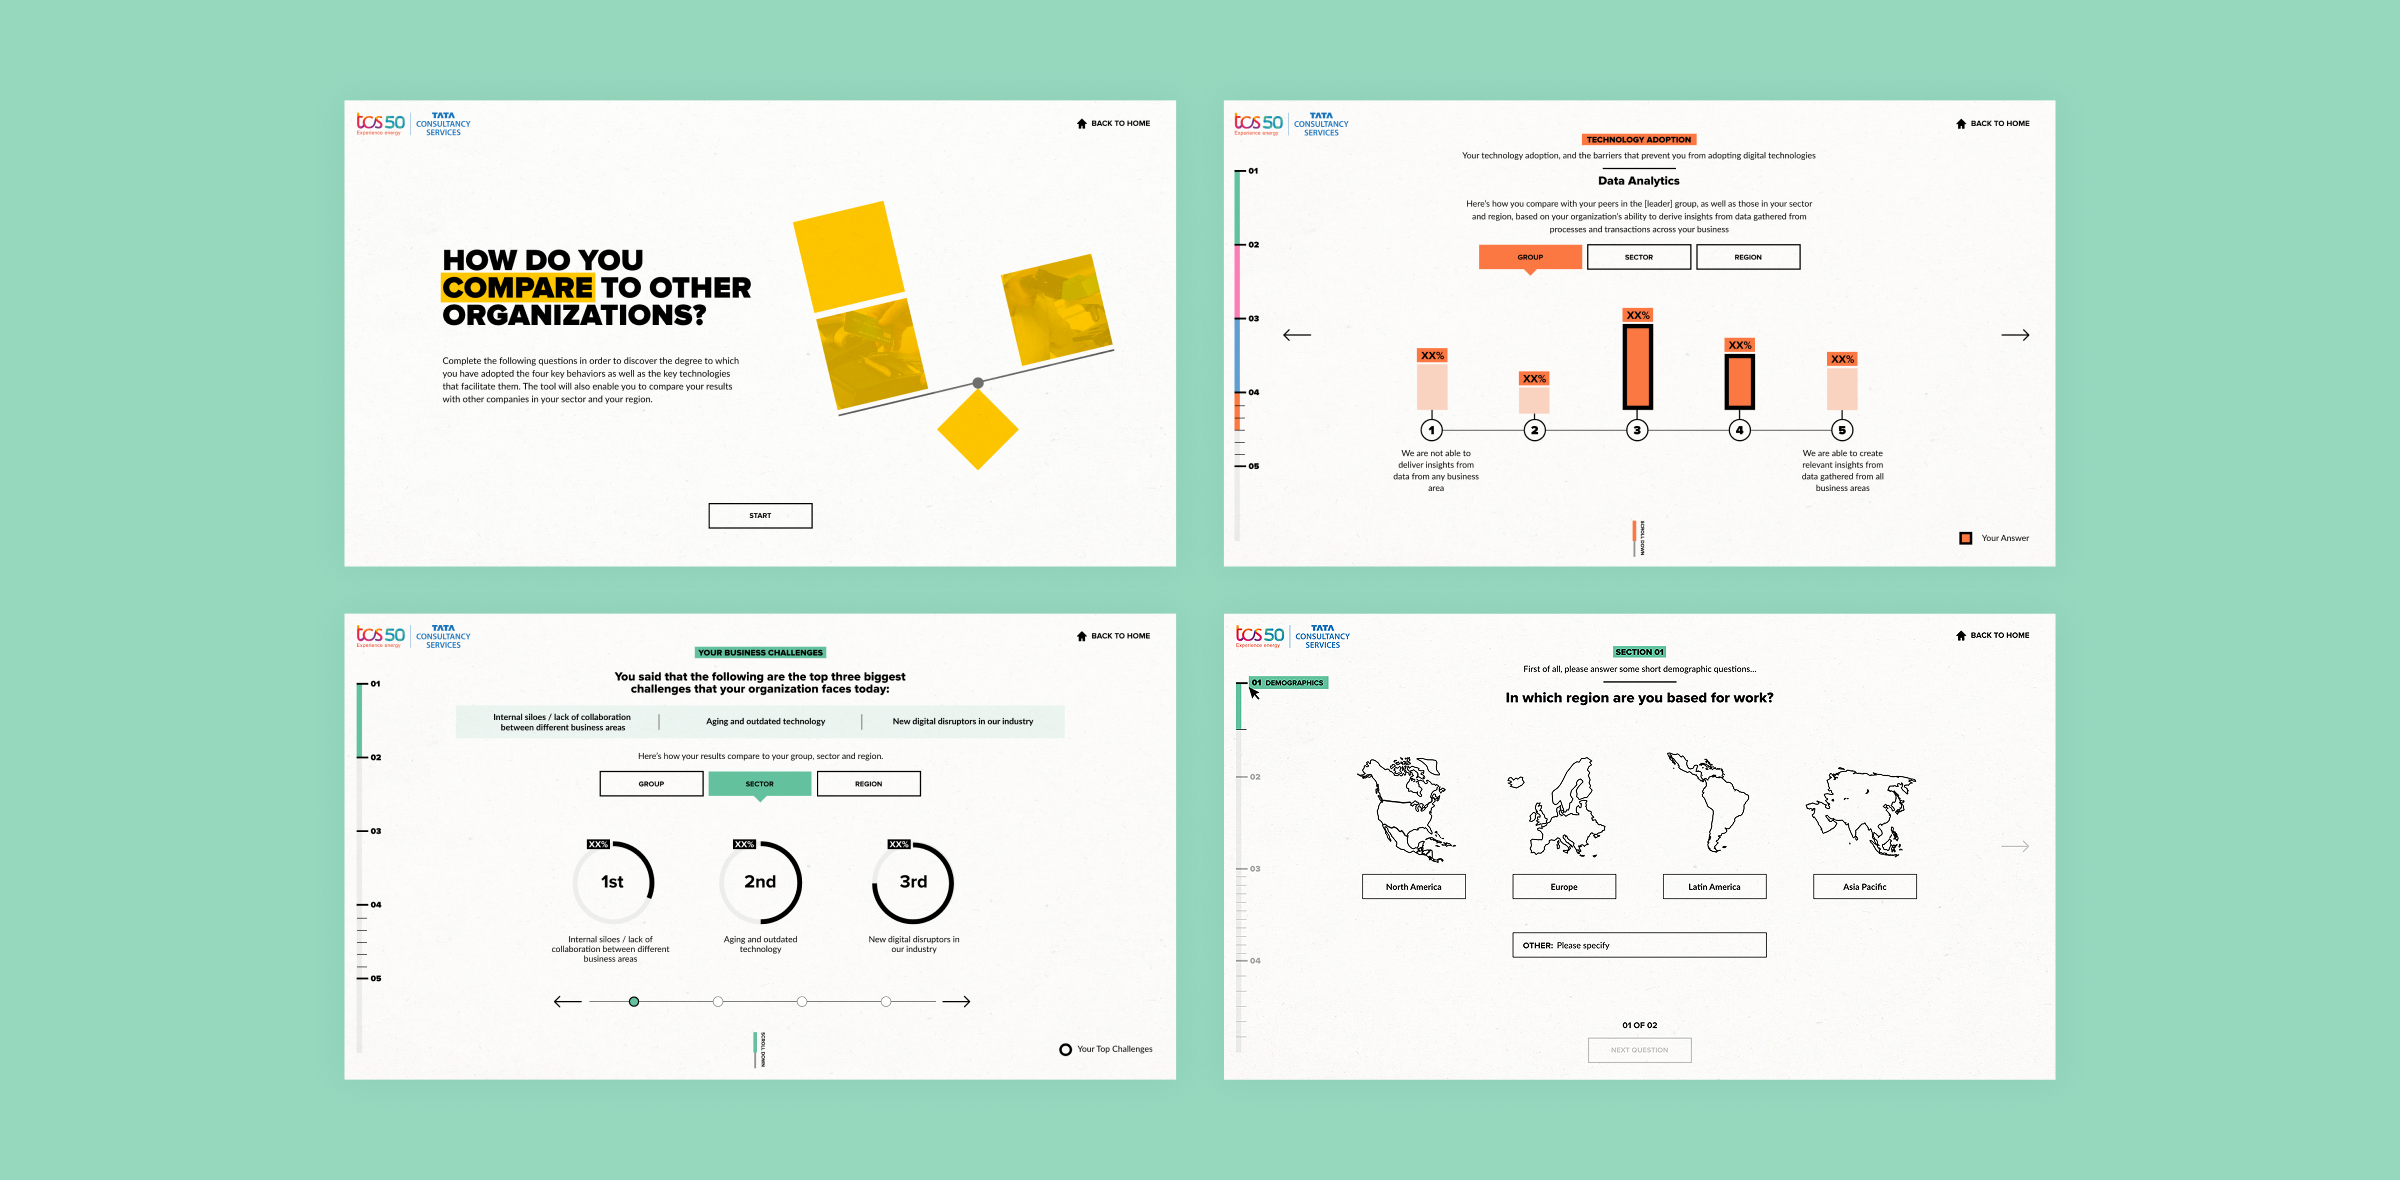
Benchmarking tools
Interactive tools that allow organisations and their audiences to compare performance, identify gaps, and understand where they stand against competitors.
- 05
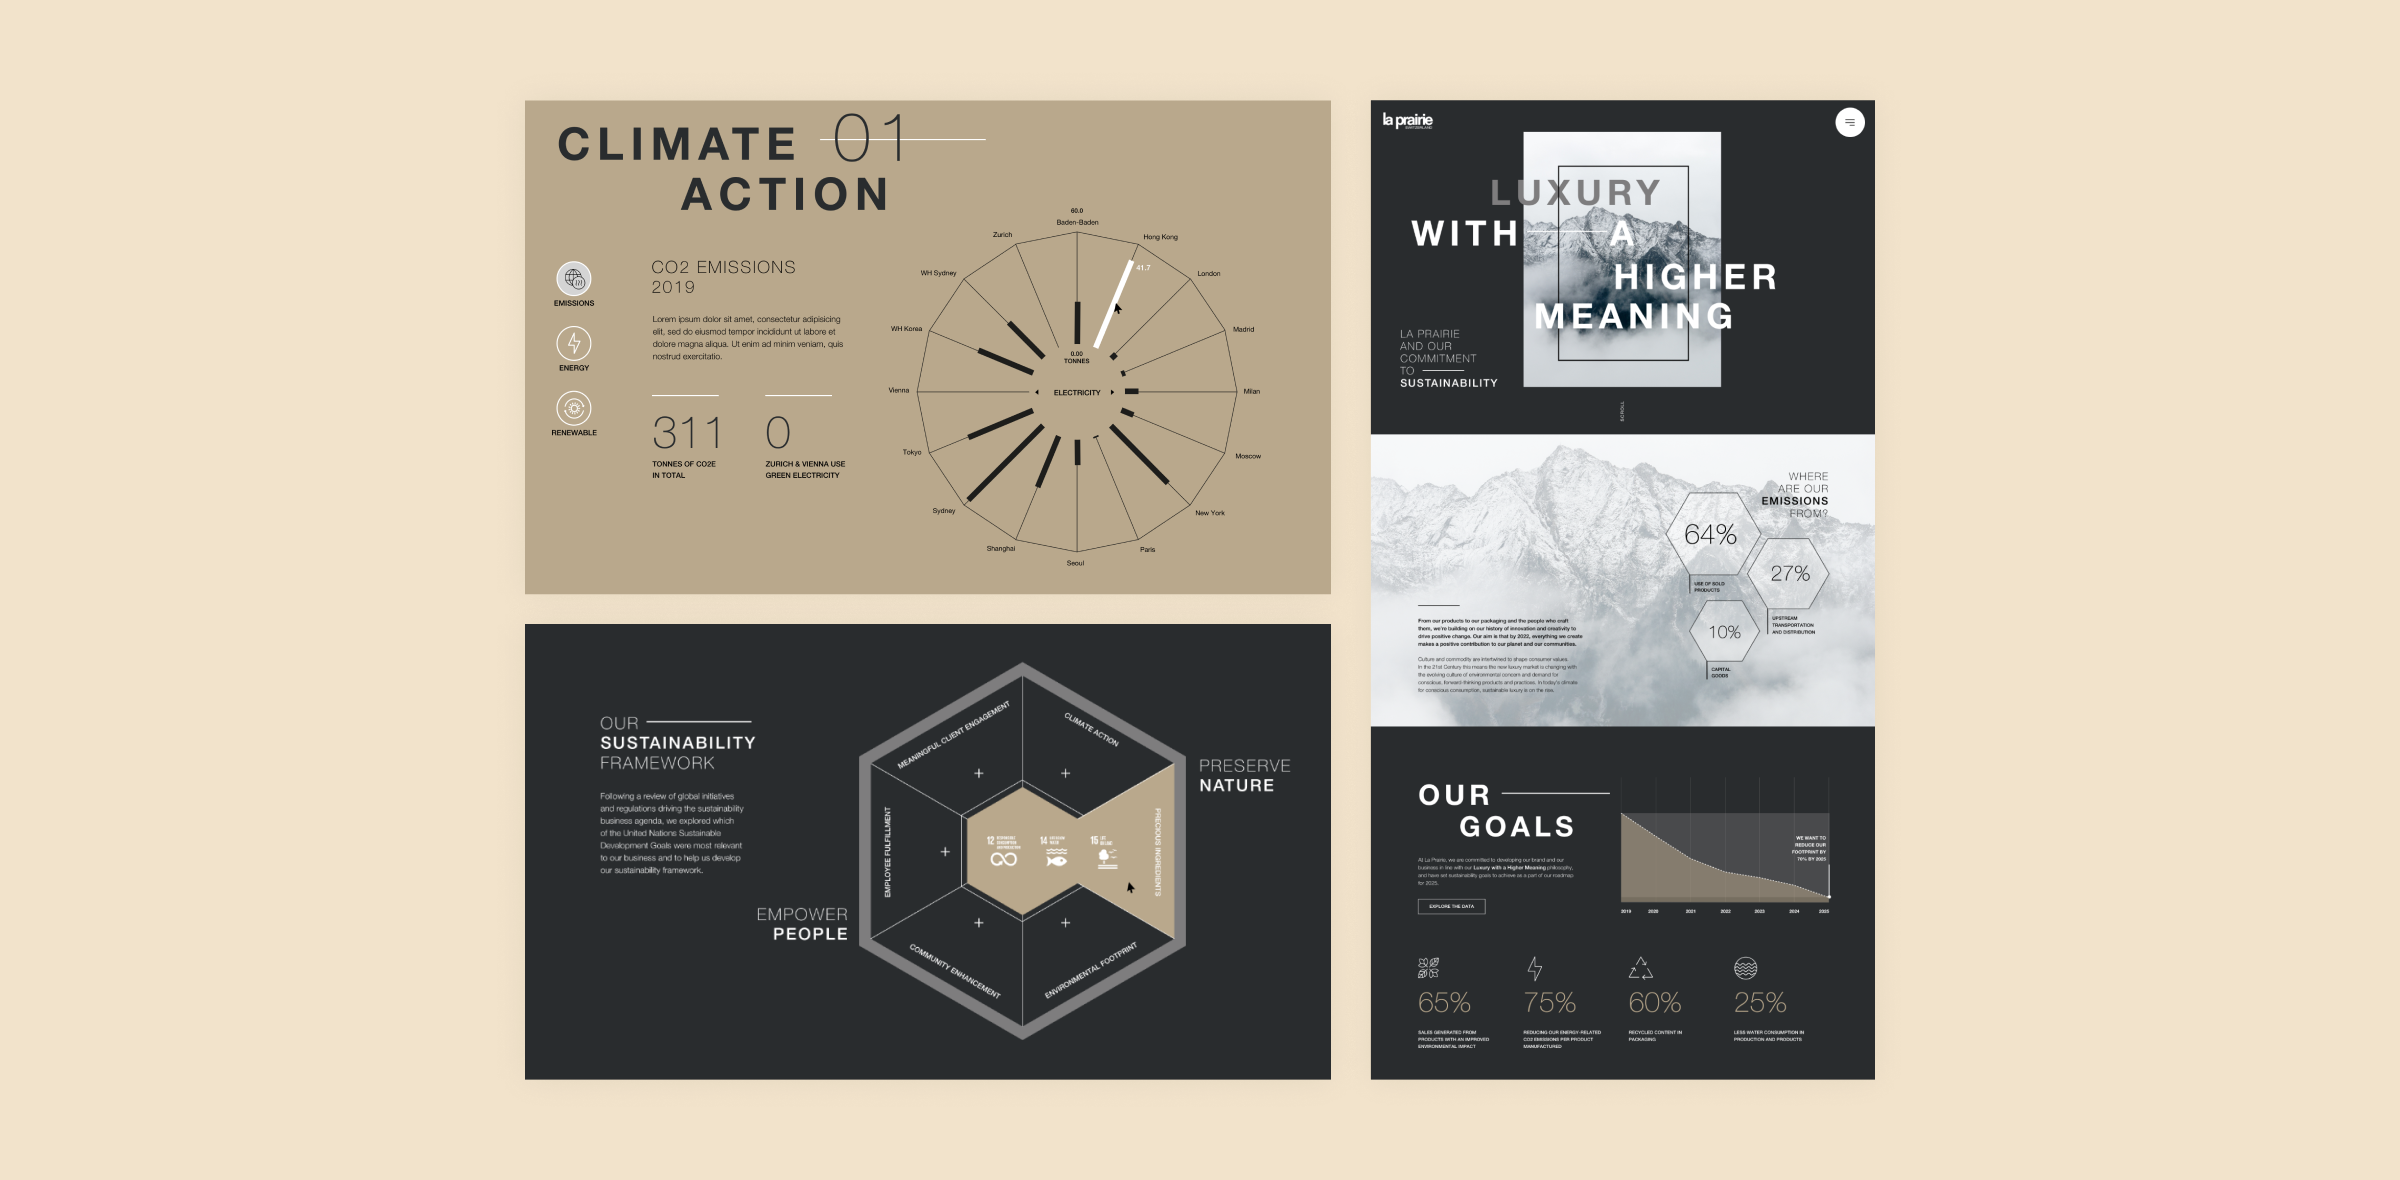
Annual reports
Data-rich reports designed to communicate impact with rigour and visual authority. We turn your data into explorable, compelling narratives that elevate understanding.
- 06
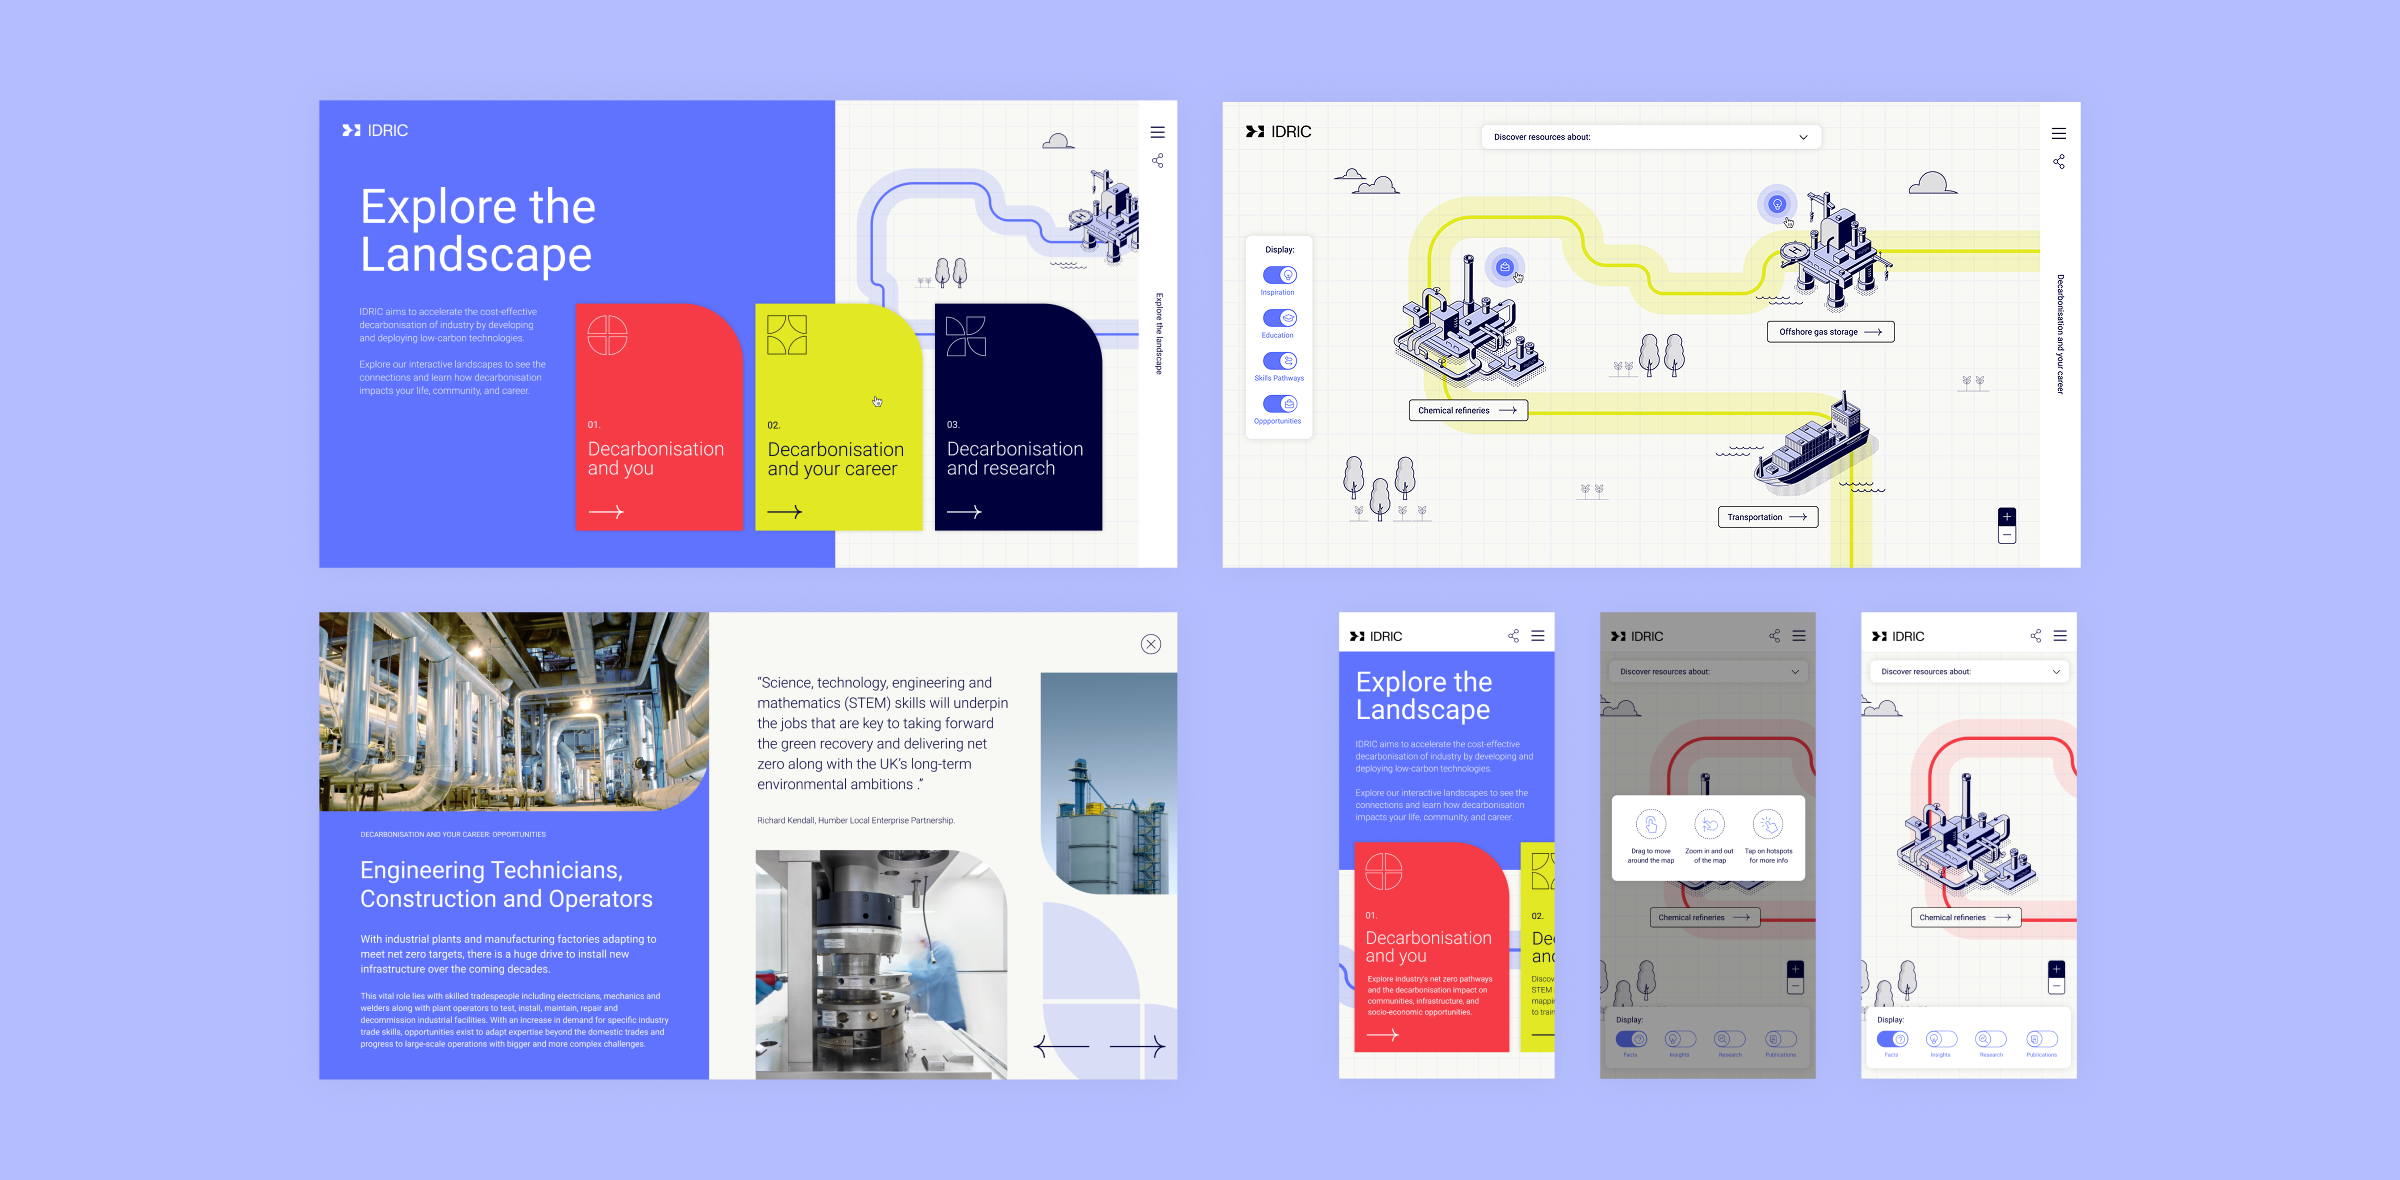
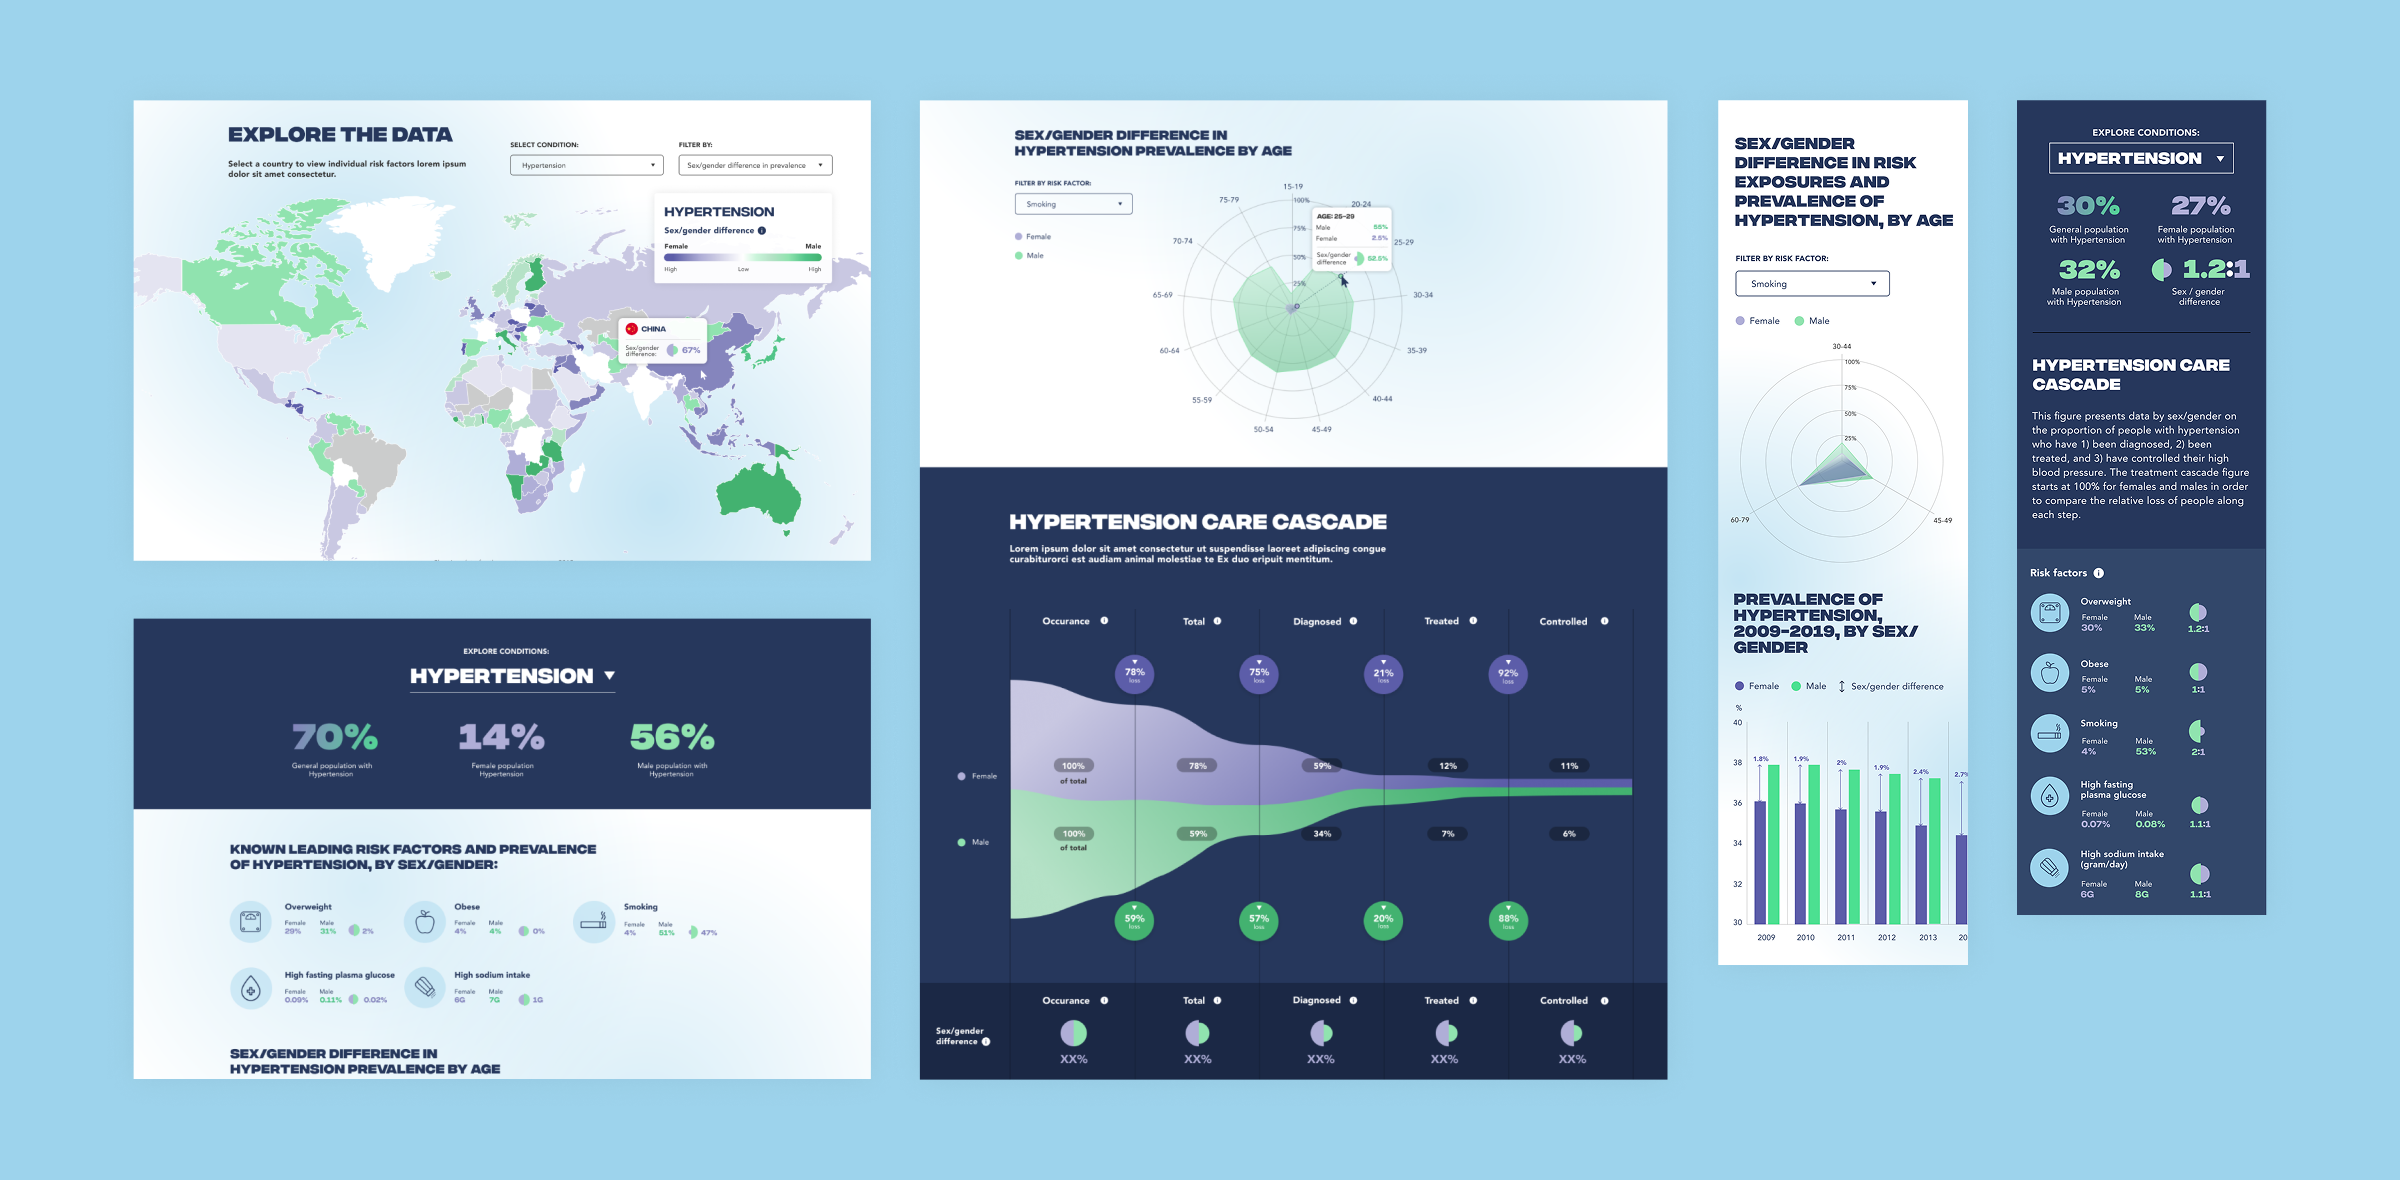
Data exploration tools
Purpose-built platforms that empower your audience to interrogate datasets, surface insights and make connections that static formats simply cannot accommodate.
- 07
Data-driven animation
Statistics and data brought to life through motion. At the intersection of our data visualisation and animation capabilities, we tell stories that educate and inspire.
Are you ready to make your data impossible to ignore?
Tell us about your brief or project, and we'll come back to you with a clear sense of how we'd approach things. No pressure, no obligation, just a useful conversation.
Alternatively you can reach us at:
[email protected]
+44 (0)1603 630631